Turkmenistan Key Figures
- Population:
- 7.49 million
- GDP growth rate:
- 2.26 %/year
- Energy independence:
- 100%
Data of the last year available: 2024
- Total consumption/GDP:*
- 111 (2015=100)
- CO2 Emissions:
- 13.4 tCO2/cap
- Rate of T&D power losses:
- 14.9%
* at purchasing power parity
View all macro and energy indicators in the Turkmenistan energy report
Turkmenistan Energy News
View all news, archive your new and create your own daily newsletters only on your topics/countries of interest with Key Energy Intelligence
Turkmenistan Energy Research
- Turkmenistan's Energy & Climate Policy Framework: Turkmenistan aims to cut GHG emissions by 20% by 2030, prioritising gas exports and oil development. Energy remains state-controlled, with recent laws promoting renewables and energy efficiency. Foreign investment in oil and gas requires national partnerships.
- Turkmenistan's Energy Companies: Turkmenistan's energy sector is dominated by three state-owned firms: Turkmenenergo (electricity), Turkmenoil (oil), and Turkmengaz (gas). Privatisation is not pursued for strategic reasons. Key foreign players include Eni, Petronas, and ExxonMobil.
- Turkmenistan's Energy Supply & Demand: Turkmenistan, with the world's 5th largest natural gas reserves, relies entirely on gas for power generation. Energy consumption has surged since 2020, with gas dominating at 85%. The country is a major gas exporter, primarily to China, and has significant oil reserves. Electricity production, also gas-powered, has grown rapidly, with substantial exports to neighbouring nations. Despite declining oil production, Turkmenistan remains a net exporter of oil products. GHG emissions have risen sharply, driven by energy combustion.
- Turkmenistan's Energy Use & Price by Sector: Gas dominates Turkmenistan's energy use (70%), with prices lower than in Russia and Kazakhstan. Final energy demand rose 3% annually since 2021, led by households and services (63%). Industry relies heavily on gas (93%), while transport demand grew marginally. Government subsidies on fuel and electricity were phased out by 2019.
- Turkmenistan's Issues & Prospects: Turkmenistan aims to boost gas exports to China via the Central Asia-China pipeline's Line D. The country is investing heavily in its energy sector, particularly hydrocarbons and electricity, with plans to expand production and exports. Key projects include new power plants, transmission lines, and gas pipelines like TAPI and the Trans-Caspian Gas Pipeline.
Benefit from up to 2 000 up-to-date data series for 186 countries in Global Energy & CO2 data
A data overview is available in the global energy statistics app
Turkmenistan Total Energy Production & Consumption
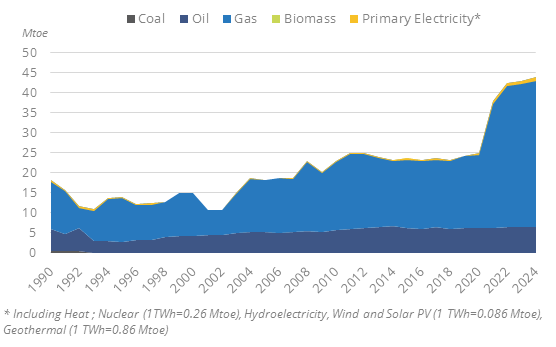
Total energy consumption has been growing rapidly since 2020 (by 6%/year), reaching 43 Mtoe in 2024. Previously, it had been increasing slowly by 0.5%/year from 2010 to 2019. Natural gas represents an increasing share of that consumption (85% in 2024, +11 pp since 2010) and oil 15%. Per capita consumption reached 5.7 toe in 2024.
Graph: Primary Consumption Trends by Energy Source
Graph: Total Consumption Market Share by Energy (2024)
Source: Turkmenistan energy report
Interactive Chart Turkmenistan Total Energy Production & Consumption
Source: Global Energy & CO2 data
Benefit from up to 2 000 up-to-date data series for 186 countries in Global Energy & CO2 data
View the detailed fondamentals of the market at country level (graphs, tables, analysis) in the Turkmenistan energy report
Turkmenistan Oil Production & Consumption
Crude oil production has been decreasing since a peak at 13 Mt in 2015 to 10 Mt in 2024(-2.5%/year).
The country has a refining capacity of 271 kb /d, distributed mainly over 2 refineries (Seydi, 120 kb/d and Türkmenbaşy 116 kb/d).
The country is a net exporter of oil products. Oil exports have been stable at 2.9 Mt since 2020. Previously they had remained stable around 2.6 Mt since 2014.
Turkmenistan shipped oil through the Baku-Tbilisi-Ceyhan pipeline.
Graph: Crude Oil Production & Consumption
Source: Turkmenistan energy report
Interactive Chart Turkmenistan Crude Oil Production & Consumption
Source: Global Energy & CO2 data
Interactive Chart Turkmenistan Refined Oil Products Production & Consumption
Source: Global Energy & CO2 data
Benefit from up to 2 000 up-to-date data series for 186 countries in Global Energy & CO2 data
Additionally, for more detailed information on refineries, you can request a sample of our EMEA Refineries Dataset
Turkmenistan Natural Gas Production & Consumption
Gas production decreased by 1.7% in 2024 to 96.3 bcm, after a rapid progression from 2020 to 2023 (6%/year). Since 2010, it has doubled. The most important fields are located in the Amu-Darya Basin in the east of the country. The largest field is Dauletabad-Donmez; according to estimates it could contain half of the country's reserves. The Murga field and the South Iolotan field also contain important reserves.
Source: Turkmenistan energy report
Interactive Chart Turkmenistan Gas Production & Consumption
Source: Global Energy & CO2 data
Benefit from up to 2 000 up-to-date data series for 186 countries in Global Energy & CO2 data
Additionally, for more detailed information on the LNG trade, you can request a sample of our EMEA LNG Trade Dataset
Turkmenistan Renewable in % Electricity Production
A Law of "On Renewable Energy Sources" was adopted in 2021 to promote the use of renewable energy. As of 2025, there was no renewable energy capacity in the country.
Source: Turkmenistan energy report
Interactive Chart Turkmenistan Share of Renewables in Electricity Production (incl hydro)
Source: Global Energy & CO2 data
Benefit from up to 2 000 up-to-date data series for 186 countries in Global Energy & CO2 data
Turkmenistan GHG emissions and CO2 emissions
In its updated NDC (2023), the government aims to reduce its GHG emissions by 20% by 2030 (relative to 2010 emissions).
Source: Turkmenistan energy report
Interactive Chart Turkmenistan CO2 emissions
Source: Global Energy & CO2 data
Benefit from up to 2 000 up-to-date data series for 186 countries in Global Energy & CO2 data
View the detailed consumption trends at country level (graphs, tables, analysis) in the Turkmenistan energy report