South Korea Key Figures
- Population:
- 51.7 million
- GDP growth rate:
- 0.90 %/year
- Energy independence:
- 21.4%
Data of the last year available: 2025
- Total consumption/GDP:*
- 84.0 (2015=100)
- CO2 Emissions:
- 10.4 tCO2/cap
- Rate of T&D power losses:
- 3.52%
* at purchasing power parity
View all macro and energy indicators in the South Korea energy report
South Korea Energy News
View all news, archive your new and create your own daily newsletters only on your topics/countries of interest with Key Energy Intelligence
South Korea Energy Research
- South Korea's Energy & Climate Policy Framework: South Korea merged climate, energy, and environment policies under a single ministry in 2025, aiming for a 53-61% GHG cut by 2035 and carbon neutrality by 2050.
- South Korea's Energy Companies: KEPCO dominates South Korea’s electricity (60% capacity), Kogas leads gas supply (91% LNG capacity), and SK Group dominates oil refining.
- South Korea's Energy Supply & Demand: Energy supply & demand summary: Total energy consumption declining since 2021; fossil fuels still dominate at 79% of primary mix.
- South Korea's Energy Use & Price by Sector: Final energy consumption declined 1.7% annually since 2021, with stable electricity/gas prices post-2023. Petroleum dominates (50%), while industry, transport, and buildings account for 27%, 19%, and 26% respectively.
- South Korea's Issues & Prospects: South Korea aims to phase out coal by 2040, boost renewables to 100GW by 2030, and expand nuclear/LNG capacity under its 11th BPLE plan.
Benefit from up to 2 000 up-to-date data series for 186 countries in Global Energy & CO2 data
A data overview is available in the global energy statistics app
South Korea Total Energy Production & Consumption
Total energy consumption has decreased by 1%/year since 2021, reaching 286 Mtoe in 2025, when it was 4% lower than its 2018 peak. It grew by 2%/year on average over 2010-2018. Per capita consumption was 5.5 toe/cap in 2025, which is more than three times the Asian average.
Graph: Primary Consumption Trends by Energy Source
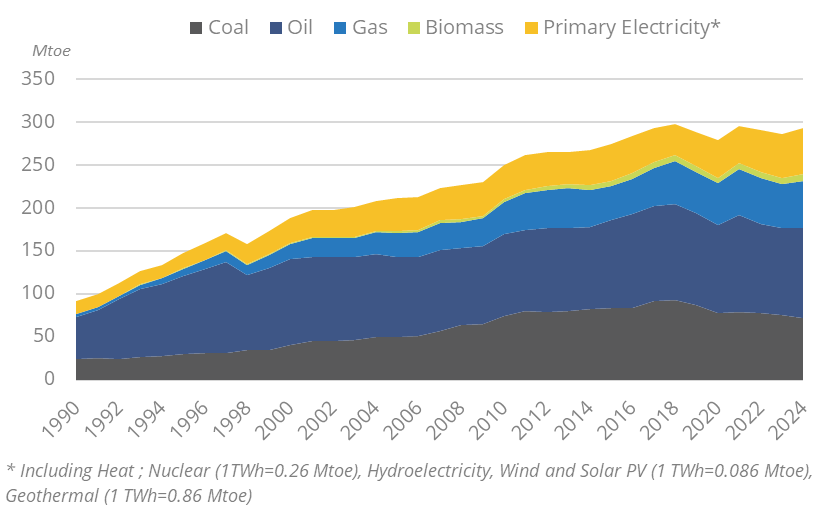
Source: South Korea energy report
Interactive Chart South Korea Total Energy Production & Consumption
Source: Global Energy & CO2 data
Benefit from up to 2 000 up-to-date data series for 186 countries in Global Energy & CO2 data
View the detailed fondamentals of the market at country level (graphs, tables, analysis) in the South Korea energy report
South Korea Oil Production & Consumption
Korea depends on imports to meet its crude oil demand, mostly from the Middle East. Crude oil and NGL imports decreased by 0.5% in 2025 to 138 Mt. This corresponds to the average import levels since 2021.
Crude oil and NGL consumption decreased by 1.6% in 2025 to 166 Mt, halting the post-COVID upward trend in oil consumption (+3%/year between 2021 and 2024).
Graph: Crude Oil Production & Consumption
Source: South Korea energy report
Interactive Chart South Korea Crude Oil Production & Consumption
Source: Global Energy & CO2 data
Interactive Chart South Korea Refined Oil Products Production & Consumption
Source: Global Energy & CO2 data
Benefit from up to 2 000 up-to-date data series for 186 countries in Global Energy & CO2 data
Additionally, for more detailed information on refineries, you can request a sample of our Asia Refineries Dataset
South Korea Natural Gas Production & Consumption
Gas production is negligible. The offshore gas field of Dong-Hae 1 entered into servicein 2004, producing around 0.15 bcm/year, i.e. less than 1% of total gas consumption.
The country started to import LNG in 1986. The volumes of LNG imports increased by 4.5%/year between 2019 and 2022 and have remained roughly stable since then (67 bcmin 2025). South Korea is the world's third largest LNG importer, after China and Japan.
In 2024, the main suppliers of LNG were Australia (24%), Qatar (19%), Malaysia (14%), the United States (12%), and Oman (10%).
Source: South Korea energy report
Interactive Chart South Korea Gas Production & Consumption
Source: Global Energy & CO2 data
Benefit from up to 2 000 up-to-date data series for 186 countries in Global Energy & CO2 data
Additionally, for more detailed information on the LNG trade, you can request a sample of our Asia LNG Trade Dataset
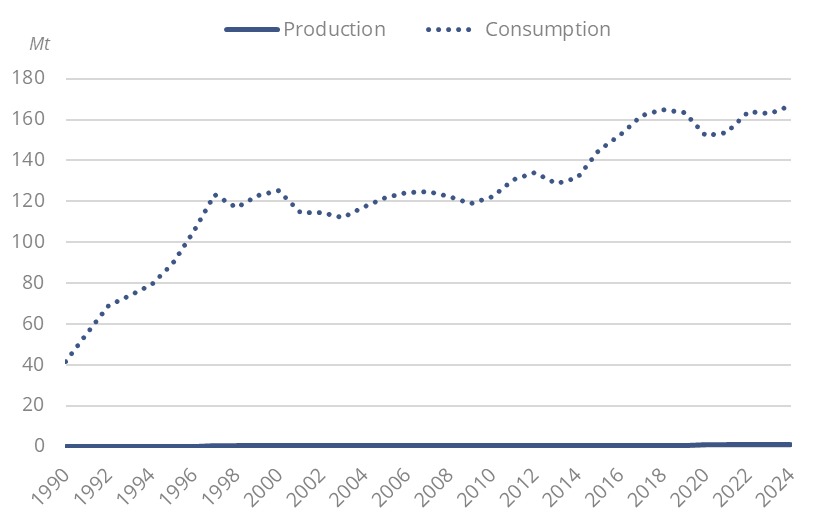
South Korea Coal and Lignite Production & Consumption
The country imports most of its coal, as production is negligible (0.4 Mt in 2025). Coal imports are generally decreasing since 2019 (-4%/year) and reached 112 Mt in 2025.
Coal consumption decreased by 0.5% in 2025 to 111 Mt, following a 5%/year fall since its peak in 2018. Previously, it increased by around 2%/year over 2010-2018.
Power plants accounted for 70% of coal consumption in 2025, coal transformation for 19% and industry for 11%.
Graph: Coal Production & Consumption
Source: South Korea energy report
Interactive Chart South Korea Coal and Lignite Production & Consumption
Source: Global Energy & CO2 data
Benefit from up to 2 000 up-to-date data series for 186 countries in Global Energy & CO2 data
View the detailed consumption trends at country level (graphs, tables, analysis) in the South Korea energy report
South Korea Renewable in % Electricity Production
KEA, Korea Energy Agency, supports and promotes new and renewable energies.
The 11th Basic Plan for Long-Term Electricity Demand and Supply (BPLE, 2025) set a renewable target of 22% of the power mix in 2030 and 33% in 2038, up from 10% in 2025. MCEE plans to add 40 GW of renewables by 2030, generating 134 TWh in 2030 (232 TWhin 2038).
Source: South Korea energy report
Interactive Chart South Korea Share of Renewables in Electricity Production (incl hydro)
Source: Global Energy & CO2 data
Benefit from up to 2 000 up-to-date data series for 186 countries in Global Energy & CO2 data
South Korea GHG emissions and CO2 emissions
In its last NDC (December 2025), the country plans to reduce its GHG emissions by 53% to 61% by 2035 relative to 2018, i.e. between 289 and 349 MtCO2 in 2035. In the previous NDC, the objective was a 40% reduction in 2030 (excl. LULUCF). In 2020, the country also committed to achieving carbon neutrality by 2050.
Source: South Korea energy report
Interactive Chart South Korea CO2 emissions
Source: Global Energy & CO2 data
Benefit from up to 2 000 up-to-date data series for 186 countries in Global Energy & CO2 data
View the detailed consumption trends at country level (graphs, tables, analysis) in the South Korea energy report