Singapore Key Figures
- Population:
- 6.08 million
- GDP growth rate:
- 2.23 %/year
- Energy independence:
- 3.30%
Data of the last year available: 2025
- Total consumption/GDP:*
- 75.5 (2015=100)
- CO2 Emissions:
- 7.81 tCO2/cap
- Rate of T&D power losses:
- 2.67%
* at purchasing power parity
View all macro and energy indicators in the Singapore energy report
Singapore Energy News
View all news, archive your new and create your own daily newsletters only on your topics/countries of interest with Key Energy Intelligence
Singapore Energy Research
- Singapore's Energy & Climate Policy Framework: Singapore’s energy & climate policy aims for 3GW solar, 2MtCO₂ CCUS by 2030, net-zero by 2050, and a rising carbon tax (SGD50-80/tCO₂ by 2030).
- Singapore's Energy Companies: Singapore’s energy sector is dominated by Tuas Power, Senoko Energy, and PowerSeraya for electricity; ExxonMobil for oil refining; and Pavilion Gas and SembCorp for gas retail.
- Singapore's Energy Supply & Demand: Singapore, a major Asian oil hub, relies on imports for energy. Gas dominates its power mix (92%), with oil (61%) and renewables (11%) also significant.
- Singapore's Energy Use & Price by Sector: Industry and non-energy use dominate final energy consumption (70%), with petroleum as the top source. Electricity prices fell in 2025, while gas and transport fuel prices rose.
- Singapore's Issues & Prospects: Singapore targets 6GW low-carbon electricity imports by 2035, expanding solar, hydrogen-ready plants, and cross-border CCS projects to meet rising demand.
Benefit from up to 2 000 up-to-date data series for 186 countries in Global Energy & CO2 data
A data overview is available in the global energy statistics app
Singapore Total Energy Production & Consumption
Primary energy consumption edged down 1% in 2025 to 30 Mtoe, following a 2% declinein 2024 and a near 3% increase in 2023. Prior to that, consumption had grown at an average rate of 3.7%/year between 2010 and 2022, with particularly sharp rises in 2012 (+28%) and 2017 (+28%). At 5 toe per capita, Singapore's primary energy consumption is almost 3 times higher than the regional average.
In 2025, oil accounted for 61% of total consumption, with a declining market share (-6 pp since 2010), followed by gas (34%, +3 pp), biomass (3%, +1 pp), and coal (2%, +2 pp).
Source: Singapore energy report
Interactive Chart Singapore Total Energy Production & Consumption
Source: Global Energy & CO2 data
Benefit from up to 2 000 up-to-date data series for 186 countries in Global Energy & CO2 data
View the detailed fondamentals of the market at country level (graphs, tables, analysis) in the Singapore energy report
Singapore Oil Production & Consumption
Singapore is the world's third largest oil products trading place. Thanks to its geographical position, at the extremity of the Strait of Malacca and on the shipping routes connecting the Middle Eastern producing countries to the Southeast Asian importing countries, Singapore is a key crossing point for oil trade in Asia. Moreover, the country built an artificial island, Jurong Island, entirely dedicated to the oil industry.
Source: Singapore energy report
Interactive Chart Singapore Crude Oil Production & Consumption
Source: Global Energy & CO2 data
Interactive Chart Singapore Refined Oil Products Production & Consumption
Source: Global Energy & CO2 data
Benefit from up to 2 000 up-to-date data series for 186 countries in Global Energy & CO2 data
Additionally, for more detailed information on refineries, you can request a sample of our Asia Refineries Dataset
Singapore Natural Gas Production & Consumption
As Singapore has no domestic gas production, it imports natural gas through three gas pipes and one LNG regasification terminal. One 4 km cross-border gas pipe links the country to Malaysia. The second pipeline is the 654 km West Natuna Transportation System pipe, which connects the gas fields of West Natuna in Indonesia to the industrial area of Jurong Island. The third pipeline is the 468 km Grissik-Batam-Singapore pipeline, which connects the fields from Sumatra in Indonesia to Singapore.
Source: Singapore energy report
Interactive Chart Singapore Gas Production & Consumption
Source: Global Energy & CO2 data
Benefit from up to 2 000 up-to-date data series for 186 countries in Global Energy & CO2 data
Additionally, for more detailed information on the LNG trade, you can request a sample of our Asia LNG Trade Dataset
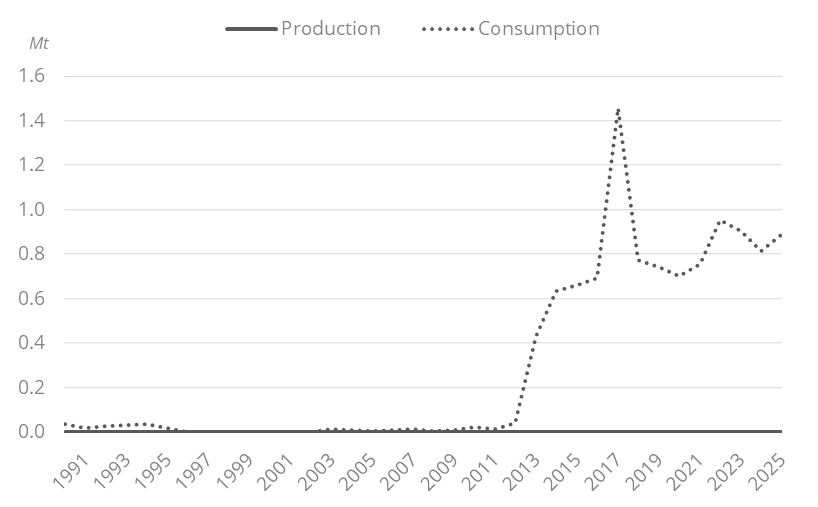
Singapore Coal and Lignite Production & Consumption
Coal consumption has increased by 6%/year on average since 2013, reaching 0.9 Mt in 2025; it rose by 10% in 2025, following declines of 10% in 2024 and 5% in 2023. Industry absorbed 60% of this consumption and power generation the remainder. All the coal is imported.
Graph: Coal Production & Consumption
Source: Singapore energy report
Interactive Chart Singapore Coal and Lignite Production & Consumption
Source: Global Energy & CO2 data
Benefit from up to 2 000 up-to-date data series for 186 countries in Global Energy & CO2 data
View the detailed consumption trends at country level (graphs, tables, analysis) in the Singapore energy report
Singapore Renewable in % Electricity Production
In February 2026, Singapore raised its solar capacity target for 2030 to 3 GW after reaching its initial 2 GW target ahead of schedule.
Solar development is supported through the SolarNova programme, launched in 2014. Led by the Economic Development Board (EDB) and the Housing & Development Board (HDB), the programme helps promote and aggregate demand for solar PV across the rooftops of HDB blocks and government buildings to achieve economies of scale. In 2019, after surpassing its initial solar target of 220 MWp by 2020, HDB announced a new solar target of 540 MWp by 2030.
Source: Singapore energy report
Interactive Chart Singapore Share of Renewables in Electricity Production (incl hydro)
Source: Global Energy & CO2 data
Benefit from up to 2 000 up-to-date data series for 186 countries in Global Energy & CO2 data
Singapore GHG emissions and CO2 emissions
In February 2025, Singapore released its updated NDC, in which it intends to reduce its GHG emissions to between 45 to 50 MtCO2eq in 2035. The first NDC set the target of reducing the GHG emission intensity by 36% from 2005 levels by 2030 (65 MtCO2eq), with an aim of achieving peak emissions around 2030. In 2022, the government announced that it would achieve net zero emissions by 2050.
Source: Singapore energy report
Interactive Chart Singapore CO2 emissions
Source: Global Energy & CO2 data
Benefit from up to 2 000 up-to-date data series for 186 countries in Global Energy & CO2 data
View the detailed consumption trends at country level (graphs, tables, analysis) in the Singapore energy report