Serbia Key Figures
- Population:
- 6.59 million
- GDP growth rate:
- 3.88 %/year
- Energy independence:
- 59.4%
Data of the last year available: 2024
- Total consumption/GDP:*
- 77.5 (2015=100)
- CO2 Emissions:
- 6.64 tCO2/cap
- Rate of T&D power losses:
- 11.4%
* at purchasing power parity
View all macro and energy indicators in the Serbia energy report
Serbia Energy News
View all news, archive your new and create your own daily newsletters only on your topics/countries of interest with Key Energy Intelligence
Serbia Energy Research
- Serbia's Energy & Climate Policy Framework: Serbia is aligning its energy and climate policies with EU standards, adopting its NECP in 2024 and amending its Energy Law to permit nuclear energy. The Ministry of Mining and Energy oversees policy through six departments, while AERS regulates the energy sector. Serbia, an EU candidate, is part of the Energy Community Treaty, requiring adoption of EU legislation. Recent updates to the Energy Law focus on harmonisation, independent oversight, and carbon neutrality. The NECP sets CO2, energy efficiency, and renewable targets for 2030, with strategies to phase out coal and lignite. The energy market is liberalised, with ongoing efforts to integrate with the EU market. Renewable energy targets aim for 33.6% of final energy consumption by 2030, supported by auctions and feed-in tariffs. Serbia also plans to develop green hydrogen and nuclear energy, while enhancing energy efficiency and climate change mitigation efforts.
- Serbia's Energy Companies: In Serbia, EPS dominates electricity (90% market share) and plans to invest EUR 4.8bn in renewables. Srbijagas leads gas (80% sales), while NIS, majority-owned by Gazprom, is the primary oil supplier. The government aims to reduce reliance on Russian energy.
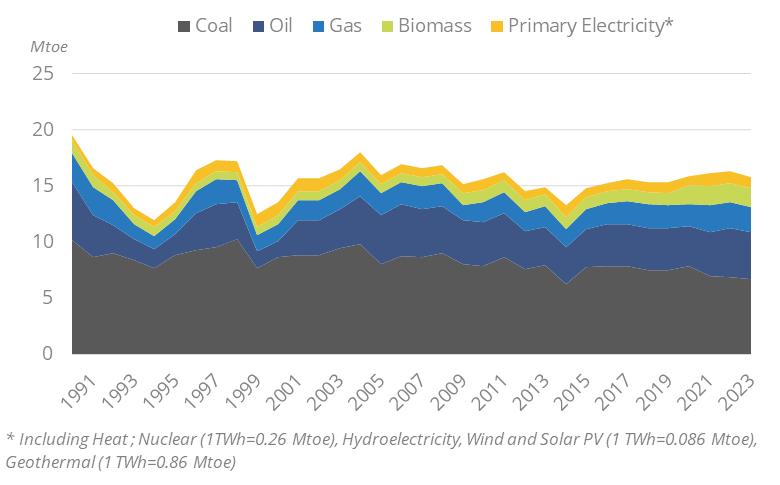
- Serbia's Energy Supply & Demand: Serbia's energy mix relies heavily on lignite, with hydropower playing a significant role. Total energy consumption has fluctuated, with a recent decline in 2023. Coal and lignite dominate primary energy use, followed by gas, oil, biomass, and hydropower. The country has limited oil and gas reserves but substantial lignite reserves. Electricity generation is influenced by hydrological conditions, with lignite and hydropower being the primary sources. Serbia is interconnected with nine countries for electricity transmission and has diversified its energy imports, including oil and gas, to reduce dependency on Russia.
- Serbia's Energy Use & Price by Sector: In 2023, Serbia's final energy consumption decreased by 2.6% to 9.9 Mtoe, with oil dominating usage. Electricity and gas prices surged but remained below EU averages. Industrial and residential sectors saw significant price hikes, while transport fuel prices hit record highs.
- Serbia's Issues & Prospects: Serbia is expanding its energy sector with significant wind and solar projects, while modernising power plants and enhancing transmission networks. The country aims for 50% renewables in final energy consumption by 2040 and climate neutrality by 2050, replacing coal with up to 22 GW of renewable capacity. Gas and hydropower projects are also under development, alongside plans for modular nuclear power plants.
Benefit from up to 2 000 up-to-date data series for 186 countries in Global Energy & CO2 data
A data overview is available in the global energy statistics app
Serbia Total Energy Production & Consumption
Energy consumption per capita amounts to 2.4 toe (14% below the EU average in 2024).
Total energy consumption has hovered around 16 Mtoe since 2005, despite an 11% dropin 2014 (energy supply problems due to massive floods); in 2024, it dipped by 1% to 15.7 Mtoe.
Graph: Primary Consumption Trends by Energy Source
Source: Serbia energy report
Interactive Chart Serbia Total Energy Production & Consumption
Source: Global Energy & CO2 data
Benefit from up to 2 000 up-to-date data series for 186 countries in Global Energy & CO2 data
View the detailed fondamentals of the market at country level (graphs, tables, analysis) in the Serbia energy report
Serbia Oil Production & Consumption
Oil fields are located in Vojvodine, in the north of the country. Crude oil production has been declining by 3.3%/year since its 2013 peak (1.2 Mt), with a 2.5% drop in 2024 to 856 kt. According to preliminary estimates, it declined again by around 2% in 2025. Previously, oil production nearly doubled between 2008 and 2013, following the acquisition of NIS by Gazprom. Production covered 23% of domestic oil supply in 2024.
Source: Serbia energy report
Interactive Chart Serbia Crude Oil Production & Consumption
Source: Global Energy & CO2 data
Interactive Chart Serbia Refined Oil Products Production & Consumption
Source: Global Energy & CO2 data
Benefit from up to 2 000 up-to-date data series for 186 countries in Global Energy & CO2 data
Additionally, for more detailed information on refineries, you can request a sample of our EMEA Refineries Dataset
Serbia Natural Gas Production & Consumption
Gas production has been decreasing rapidly since 2015 (-7%/year), reaching 297 mcmin 2024 (-5.7% in 2024), i.e., 10% of the consumption; according to preliminary estimates, it declined again by around 2% in 2025. Previously, gas production more than doubled between 2007 and 2015.
Source: Serbia energy report
Interactive Chart Serbia Gas Production & Consumption
Source: Global Energy & CO2 data
Benefit from up to 2 000 up-to-date data series for 186 countries in Global Energy & CO2 data
Additionally, for more detailed information on the LNG trade, you can request a sample of our EMEA LNG Trade Dataset
Serbia Coal and Lignite Production & Consumption
Lignite production has been declining by nearly 6%/year since 2020, reaching 31 Mt in 2024 (-2% in 2024 alone), after a plateau at 39 Mt between 2015 and 2020. Previously, it averaged 40 Mt/year between 2010 and 2013 and fell by 25% to 30 Mt in 2014 due to massive floods. It is carried out in two open sky mines: Kolubara (more than ¾ of production) and Kostolac. According to preliminary estimates, lignite production rose by 6% to 33 Mt in 2025.
Source: Serbia energy report
Interactive Chart Serbia Coal and Lignite Production & Consumption
Source: Global Energy & CO2 data
Benefit from up to 2 000 up-to-date data series for 186 countries in Global Energy & CO2 data
View the detailed consumption trends at country level (graphs, tables, analysis) in the Serbia energy report
Serbia Renewable in % Electricity Production
The final NECP (2024) sets a target of 33.6% of renewables in final energy consumptionin 2030 (45% for electricity, 41% for heating and cooling, and 7% for transport), which is below the target set by the Energy Community (40.7%). In 2024, this share averaged 26% (32.1% for electricity, 37.2% for heating, and 0.6% for transport). The NECP aims to add around 3.5 GW of new solar and wind power capacity by 2030. By 2040, Serbia also plans to replace fuel oil and coal in district heating plants with solar, wood biomass, heat pumps, municipal waste, and geothermal energy.
Source: Serbia energy report
Interactive Chart Serbia Share of Renewables in Electricity Production (incl hydro)
Source: Global Energy & CO2 data
Benefit from up to 2 000 up-to-date data series for 186 countries in Global Energy & CO2 data
Learn more about renewables in the European Battery Market Analysis
Serbia GHG emissions and CO2 emissions
Serbia's updated Nationally Determined Contribution (NDC) for the period up to 2035 (September 2025) sets a conditional greenhouse gas (GHG) emission reduction target of 40.1% by 2035 compared to 1990, excluding the land use, land use change, and forestry (LULUCF) sector. This target is temporary, until the adoption of new targets for 2040 in a new integrated NECP, and conditional to national available financial resources. Under its previous NDC (2022), Serbia raised its GHG emissions reduction target to 33.3% by 2030 compared with 1990 levels (i.e. 13% compared to 2010).
Source: Serbia energy report
Interactive Chart Serbia CO2 emissions
Source: Global Energy & CO2 data
Benefit from up to 2 000 up-to-date data series for 186 countries in Global Energy & CO2 data
View the detailed consumption trends at country level (graphs, tables, analysis) in the Serbia energy report