Romania Key Figures
- Population:
- 18.9 million
- GDP growth rate:
- 0.86 %/year
- Energy independence:
- 68.5%
Data of the last year available: 2024
- Total consumption/GDP:*
- 44.6 (2005=100)
- CO2 Emissions:
- 3.23 tCO2/capita
- Rate of T&D power losses:
- 11.5%
* at purchasing power parity
View all macro and energy indicators in the Romania energy report
Romania Energy News
View all news, archive your new and create your own daily newsletters only on your topics/countries of interest with Key Energy Intelligence
Romania Energy Research
Benefit from up to 2 000 up-to-date data series for 186 countries in Global Energy & CO2 data
A data overview is available in the global energy statistics app
Romania Total Energy Production & Consumption
Energy consumption per capita is about 1.6 toe (2024), which is 43% below the EU average, and electricity consumption amounts to 2 400 kWh/cap (57% below the EU average).
Total energy consumption remained stable at 30 Mtoe in 2024, after a sharp reduction since 2020 (-5.5%/year). It has been declining by around 1%/year from 2010 to 2020 and rebounded by 6% in 2021.
Graph: CONSUMPTION TRENDS BY ENERGY SOURCE (Mtoe)
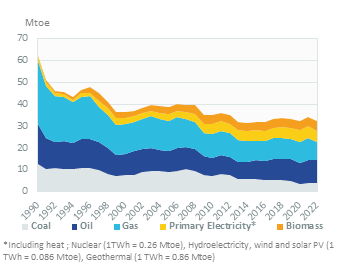
Source: Romania energy report
Interactive Chart Romania Total Energy Production & Consumption
Source: Global Energy & CO2 data
Benefit from up to 2 000 up-to-date data series for 186 countries in Global Energy & CO2 data
View the detailed fondamentals of the market at country level (graphs, tables, analysis) in the Romania energy report
Romania Oil Production & Consumption
Oil production has been declining by 4%/year since 2002, reaching 2.9 Mt in 2024, i.e. 24% of crude oil consumption. Crude imports have been fluctuating in a range of 8-9 Mt since 2016 (9 Mt in 2024).
The refining capacity stands at 250 kb/d (end of 2024). The output of oil products has ranged between 10 and 13 Mt/year since 2010; after a 10% decrease in 2023, it rebounded by 7% in 2024 to 12 Mt. Romania exports nearly 40% of its oil product production (4.3 Mt in 2024). Oil product imports have been rising since 2010 (2.2 Mt) to 4 Mt in 2024.
Source: Romania energy report
Interactive Chart Romania Crude Oil Production & Consumption
Source: Global Energy & CO2 data
Interactive Chart Romania Refined Oil Products Production & Consumption
Source: Global Energy & CO2 data
Benefit from up to 2 000 up-to-date data series for 186 countries in Global Energy & CO2 data
Additionally, for more detailed information on refineries, you can request a sample of our EMEA Refineries Dataset
Romania Natural Gas Production & Consumption
In 2024, gas consumption rebounded by 3.7% to 9.9 bcm, after a 17% fall in 2022 and a 4.3% decline in 2023, driven by high gas prices. Overall, gas consumption halved between 1990 and 2000 and contracted by 2%/year until 2020. In recent years, the closure of petrochemical facilities contributed to this decline.
In 2024, buildings (households and services) accounted for 45% of gas demand (up from 30% in 2010), industry for 19% (down from 33% in 2010), and the power sector for 27% (21% in 2010).
Graph: NATURAL GAS CONSUMPTION (bcm)
Source: Romania energy report
Interactive Chart Romania Gas Production & Consumption
Source: Global Energy & CO2 data
Benefit from up to 2 000 up-to-date data series for 186 countries in Global Energy & CO2 data
Additionally, for more detailed information on the LNG trade, you can request a sample of our EMEA LNG Trade Dataset
Romania Coal and Lignite Production & Consumption
Lignite consumption fell by 31% in 2024 to 11 Mt, after a 23% drop in 2023, returning to its downward trend (-8%/year on average since 2010), despite a 15% rebound in 2021. In 2024, it was 77% below its 1990 level and 68% below its 2010 level.
Since most lignite is consumed in power plants (94% in 2024), the commissioning of a new nuclear unit in 2007, growing wind power generation, and lignite-fired capacity retirements have contributed to reducing lignite consumption.
Graph: LIGNITE CONSUMPTION (Mt)
Source: Romania energy report
Interactive Chart Romania Coal and Lignite Production & Consumption
Source: Global Energy & CO2 data
Benefit from up to 2 000 up-to-date data series for 186 countries in Global Energy & CO2 data
View the detailed consumption trends at country level (graphs, tables, analysis) in the Romania energy report
Romania Power Production & Consumption
Electricity consumption rebounded by 3.6% in 2024 to 45 TWh, after a contraction by 6%/year from 2021 to 2023, due to high electricity prices since 2022.
Industry is the largest electricity consumer with 38% of total electricity consumption in 2024, followed by households with 30% and services with 24%.
Graph: ELECTRICITY CONSUMPTION (TWh)

Graph: ELECTRICITY CONSUMPTION BREAKDOWN BY SECTOR (2024 %)
Source: Romania energy report
Interactive Chart Romania Power Production & Consumption
Source: Global Energy & CO2 data
Benefit from up to 2 000 up-to-date data series for 186 countries in Global Energy & CO2 data
View the detailed consumption trends at country level (graphs, tables, analysis) in the Romania energy report
Romania Renewable in % Electricity Production
According to its final revised NECP, Romania aims to raise the share of renewables in final energy consumption to 38.3% in 2030 (below the 41% share recommended by the EU Commission), including 57.8% in electricity consumption, 41.1% in heating and cooling, and 29.4% in transport. In 2023, renewables covered 25.8% of final energy consumption, including 47.4% for electricity, 29.1% for heating, and 8% in transport.
The country slightly exceeded its 2020 target on renewables with a share of renewables in final energy consumption of 24.5% (+0.5 point).
Source: Romania energy report
Interactive Chart Romania Share of Renewables in Electricity Production (incl hydro)
Source: Global Energy & CO2 data
Benefit from up to 2 000 up-to-date data series for 186 countries in Global Energy & CO2 data
Learn more about renewables in the European Battery Market Analysis
Romania GHG emissions and CO2 emissions
According to its final revised NECP (2024), Romania aims to cut its GHG emissions by 85% in 2030 compared to 1990 to 34 MtCO2eq, thanks to massive reductions in the energy sector (-87%), industry (-77%), and agriculture (-44%), while increasing GHG removals and limiting the increase in emissions from transport to 40%. Romania aims to cut emissions under the ETS scheme by 43.9% by 2030 (compared to 2005). For 2040, Romania targets a 96% net GHG emission reduction (compared to 1990) to 8.35 MtCO2eq, negative emissions as of 2045 and a 105% reduction in 2050 (-11 MtCO2eq).
Source: Romania energy report
Interactive Chart Romania CO2 emissions
Source: Global Energy & CO2 data
Benefit from up to 2 000 up-to-date data series for 186 countries in Global Energy & CO2 data
View the detailed consumption trends at country level (graphs, tables, analysis) in the Romania energy report