Niger Key Figures
- Population:
- 26.2 million
- GDP growth rate:
- 1.67 %/year
- Energy independence:
- 98.6%
Data of the last year available: 2023
- Total consumption/GDP:*
- 84.1 (2015=100)
- CO2 Emissions:
- 0.12 tCO2/cap
- Rate of T&D power losses:
- 20.9%
* at purchasing power parity
View all macro and energy indicators in the Niger energy report
Niger Energy News
View all news, archive your new and create your own daily newsletters only on your topics/countries of interest with Key Energy Intelligence
Niger Energy Research
- Niger's Energy & Climate Policy Framework: Niger aims to boost energy capacity to 850 MW by 2030 and achieve 80% electrification by 2035, with a focus on renewables and private sector involvement. Recent policy reforms and international partnerships support these goals, despite political challenges.
- Niger's Energy Companies: Niger has liberalised power generation, with Istithmar West Africa as the leading producer. The government nationalised key energy firms, including Nigelec and Somair. CNPC dominates the oil sector, while uranium production faces challenges due to geopolitical tensions.
- Niger's Energy Supply & Demand: Niger relies heavily on Nigeria for electricity imports, with biomass and oil dominating its energy mix. Despite rapid population growth, per capita energy consumption remains among the lowest globally. Recent developments include a new oil export pipeline and increased solar energy capacity. Uranium production has significantly declined, and electricity infrastructure is fragmented.
- Niger's Energy Use & Price by Sector: In 2023, final energy consumption in this region was dominated by biomass (69%), with limited access to clean cooking and electricity. The residential sector was the largest consumer (75%), followed by transport (21%) and industry (4%). Energy prices are government-regulated and subsidised, particularly for electricity.
- Niger's Issues & Prospects: Niger's energy projects face delays post-coup, with hydro, solar, wind, and nuclear initiatives underway. Key projects include the Kandadji dam, 450 MW of solar, 250 MW of wind, and a 2 GW nuclear plant by 2030. Transmission and oil/gas developments are also progressing.
Benefit from up to 2 000 up-to-date data series for 186 countries in Global Energy & CO2 data
A data overview is available in the global energy statistics app
Niger Total Energy Production & Consumption
In 2023, primary energy consumption rose by 2.6% to 3.1 Mtoe. Since 2017, consumption has grown by an average of 5.6%/year. In a context of rapid population growth (almost 4%/year over 2010-2023), the country's total energy consumption per capita remains small at 0.12 toe in 2023 (stable compared to 2010 but 74% below the Sub-Saharan average). It is the lowest energy consumption per capita in West Africa and the 4th lowest in the world.
Graph: Primary Consumption Trends by Energy Source
Source: Niger energy report
Interactive Chart Niger Total Energy Production & Consumption
Source: Global Energy & CO2 data
Benefit from up to 2 000 up-to-date data series for 186 countries in Global Energy & CO2 data
View the detailed fondamentals of the market at country level (graphs, tables, analysis) in the Niger energy report
Niger Oil Production & Consumption
Oil production reached 0.9 Mt in 2023, rebounding by 15% after an 11% drop in 2022. Oil production started in 2011 and has averaged 850 kt/year since 2013.
A 1 980 km oil pipeline (4.5 Mt/year) linking the Agadem oil fields (90 kb/d capacity) to the port of Cotonou in Benin to enable exports of crude oil was commissioned in 2024. However, the US$4bn pipeline was stopped in May 2024, following a dispute between the governments of Niger and Benin. Exports restarted in August 2024.
Graph: Crude Oil Production & Consumption
Source: Niger energy report
Interactive Chart Niger Crude Oil Production & Consumption
Source: Global Energy & CO2 data
Interactive Chart Niger Refined Oil Products Production & Consumption
Source: Global Energy & CO2 data
Benefit from up to 2 000 up-to-date data series for 186 countries in Global Energy & CO2 data
Additionally, for more detailed information on refineries, you can request a sample of our EMEA Refineries Dataset
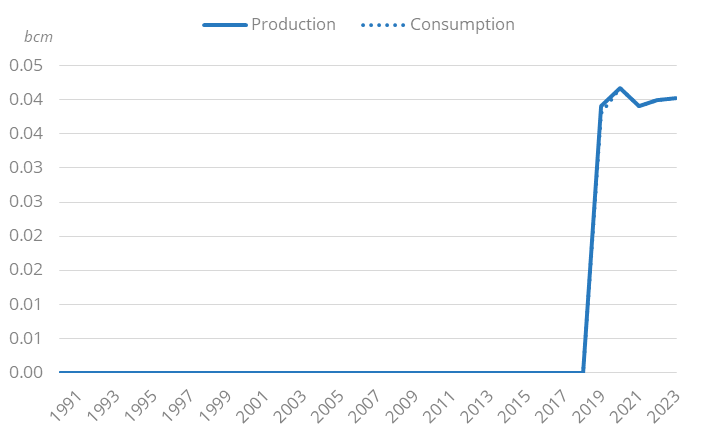
Niger Natural Gas Production & Consumption
Gas production stood at 40 mcm in 2023, a level that has remained stable since 2019, the year Niger began producing gas. Since then, the country has consumed its entire production domestically, for its power sector.
Graph: Gas Production & Consumption
Source: Niger energy report
Interactive Chart Niger Gas Production & Consumption
Source: Global Energy & CO2 data
Benefit from up to 2 000 up-to-date data series for 186 countries in Global Energy & CO2 data
Additionally, for more detailed information on the LNG trade, you can request a sample of our EMEA LNG Trade Dataset
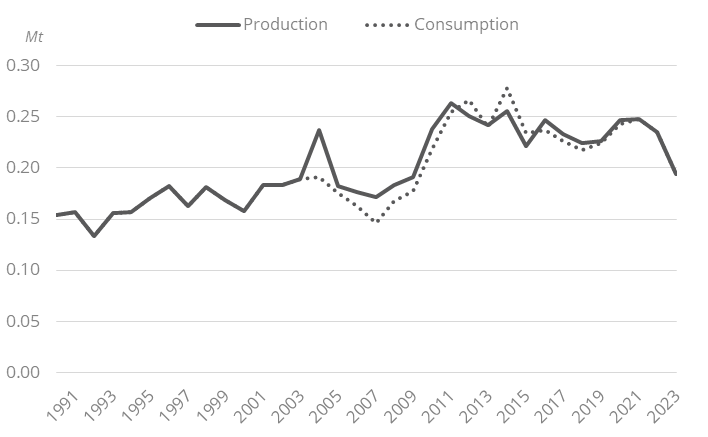
Niger Coal and Lignite Production & Consumption
Coal production is low (0.2 Mt in 2023, -18% compared to 2022) and declining (-1.6%/year since 2010). It is almost entirely consumed domestically for the production of electricity (97% in 2023).
Graph: Coal Production & Consumption
Source: Niger energy report
Interactive Chart Niger Coal and Lignite Production & Consumption
Source: Global Energy & CO2 data
Benefit from up to 2 000 up-to-date data series for 186 countries in Global Energy & CO2 data
View the detailed consumption trends at country level (graphs, tables, analysis) in the Niger energy report
Niger Renewable in % Electricity Production
According to the country's National Renewable Energy Action Plan (NREAP, 2015), renewables (including hydro) were to account for 51% of the installed capacity by 2020 and 58% by 2030; however, the 2020 target was not reached, with renewables representing less than 5% of the capacity. The NREAP also sets a target of 30% access to electricity from renewable energy sources by 2030 for rural populations. The new PDES includes an objective of 15% of solar in the power mix in 2026 (nearly reached in 2023).
Source: Niger energy report
Interactive Chart Niger Share of Renewables in Electricity Production (incl hydro)
Source: Global Energy & CO2 data
Benefit from up to 2 000 up-to-date data series for 186 countries in Global Energy & CO2 data
Niger GHG emissions and CO2 emissions
In its updated NDC (2021), Niger targets an unconditional GHG emissions reduction of 12.6% by 2030 from a BAU scenario in the Agriculture, Forestry, and other Land Use sector, and a conditional reduction of 22.75% by 2030. For the energy sector, it targets an unconditional GHG emission reduction of 10.6% by 2030, raised to 45% with international support. Estimated costs for the application of the NDC amount to US$2.6bn for unconditional targets and US$7.3bn for conditional targets. Almost 68% of the total cost is directed towards climate adaptation.
Source: Niger energy report
Interactive Chart Niger CO2 emissions
Source: Global Energy & CO2 data
Benefit from up to 2 000 up-to-date data series for 186 countries in Global Energy & CO2 data
View the detailed consumption trends at country level (graphs, tables, analysis) in the Niger energy report