Mozambique Key Figures
- Population:
- 33.6 million
- GDP growth rate:
- 5.44 %/year
- Energy independence:
- 100%
Data of the last year available: 2023
- Total consumption/GDP:*
- 88.6 (2015=100)
- CO2 Emissions:
- 0.25 tCO2/cap
- Rate of T&D power losses:
- 18.7%
* at purchasing power parity
View all macro and energy indicators in the Mozambique energy report
Mozambique Energy News
View all news, archive your new and create your own daily newsletters only on your topics/countries of interest with Key Energy Intelligence
Mozambique Energy Research
- Mozambique's Energy & Climate Policy Framework: Mozambique aims for 100% electrification by 2030, doubling hydropower capacity and reducing GHG emissions by 40 MtCO2eq by 2025 with international support. MIREME oversees energy policy, while ARENE regulates oil, gas, and power sectors. The National Electrification Strategy targets 68% grid connections and 30% off-grid solutions by 2030. Renewable energy initiatives, including solar and wind projects, are being promoted to meet domestic and regional demand. The government also focuses on energy efficiency and green hydrogen production.
- Mozambique's Energy Companies: EDM dominates Mozambique's power sector, generating 70% of electricity, including hydro from Cahora Bassa. Major gas blocks are operated by Eni, ExxonMobil, and TotalEnergies. ENH oversees oil and gas exploration, while Petromoc leads fuel distribution. Coal production is led by Vulcan at the Moatize mine.
- Mozambique's Energy Supply & Demand: Mozambique boasts significant energy resources, including hydroelectricity, natural gas, and coal. Hydro dominates electricity production (82%), while gas exports surged post-2022 LNG terminal launch. Biomass remains the primary energy source, with oil and gas playing smaller roles. Energy supply has grown steadily, though per capita consumption lags behind Sub-Saharan averages.
- Mozambique's Energy Use & Price by Sector: Low per capita energy use; biomass dominates (64%). Electricity prices subsidised since 2012. Final energy demand grew 4%/year since 2010, with households and services consuming 63%. Transport sector's share tripled, while industry's declined. Electricity use stable at 1.1 TWh since 2014, with industry as the largest consumer.
- Mozambique's Issues & Prospects: Mozambique is expanding its energy sector with significant gas, hydropower, and renewable projects, including the 450 MW Temane gas plant and the 1,500 MW Mphanda Nkuwa hydropower project. The country aims to become a major gas player and transition to electricity as its core energy source.
Benefit from up to 2 000 up-to-date data series for 186 countries in Global Energy & CO2 data
A data overview is available in the global energy statistics app
Mozambique Total Energy Production & Consumption
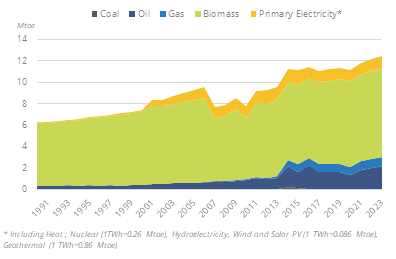
Total energy supply has increased by almost 4%/year since 2010 to 12.5 Mtoe (+60%).
Per capita consumption was around 0.37 toe in 2023, which is 18% below the Sub-Saharan African average (0.45 toe).
Graph: Primary Consumption Trends by Energy Source (Mtoe)
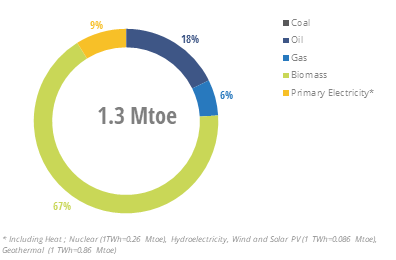
Graph: Total Consumption Market Share by Energy (2023, %)
Source: Mozambique energy report
Interactive Chart Mozambique Total Energy Production & Consumption
Source: Global Energy & CO2 data
Benefit from up to 2 000 up-to-date data series for 186 countries in Global Energy & CO2 data
View the detailed fondamentals of the market at country level (graphs, tables, analysis) in the Mozambique energy report
Mozambique Oil Production & Consumption
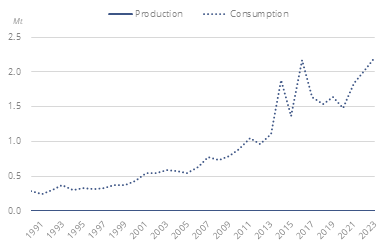
Since Mozambique produces crude oil and NGL in very limited quantity -around 10 kt/year- and has no refinery, all the oil products supplied are imported; oil consumption, and thus imports, are growing very rapidly (7%/year since 2010 to 2.2 Mt in 2023).
Graph: Petroleum Products Production & Consumption (Mt)
Source: Mozambique energy report
Interactive Chart Mozambique Crude Oil Production & Consumption
Source: Global Energy & CO2 data
Interactive Chart Mozambique Refined Oil Products Production & Consumption
Source: Global Energy & CO2 data
Benefit from up to 2 000 up-to-date data series for 186 countries in Global Energy & CO2 data
Additionally, for more detailed information on refineries, you can request a sample of our EMEA Refineries Dataset
Mozambique Natural Gas Production & Consumption
Gas production started in 2004 and increased rapidly to 5 bcm in 2015; it was stable until 2022 and rose by 75% in 2023 to 8.5 bcm with the start-up of the LNG facility.
A 3.4 Mt/year Floating LNG liquefaction terminal was commissioned by Mozambique Rovuma Venture (MRV) in 2022. It is supplied with gas from Area 4. The entire LNG production is going to BP over 20 years, with an option for an additional ten-year term.
Source: Mozambique energy report
Interactive Chart Mozambique Gas Production & Consumption
Source: Global Energy & CO2 data
Benefit from up to 2 000 up-to-date data series for 186 countries in Global Energy & CO2 data
Additionally, for more detailed information on the LNG trade, you can request a sample of our EMEA LNG Trade Dataset
Mozambique Renewable in % Electricity Production
The Just Energy Transition Strategy (2024) focuses on 4 pillars: modern energy systems based on renewable energy sources, green industrialisation, adoption of clean energy transport, and universal access to modern energy. Pillar 1 sets the following targets for renewables for 2030: +2-4 GW of hydro (+9 GW by 2040), +2 GW of solar PV (+5.5-11 GW by 2050), and+0.2-0.5 GW of wind (+2-3 GW by 2050) to meet not only domestic demand but also the needs of neighboring countries.
Source: Mozambique energy report
Interactive Chart Mozambique Share of Renewables in Electricity Production (incl hydro)
Source: Global Energy & CO2 data
Benefit from up to 2 000 up-to-date data series for 186 countries in Global Energy & CO2 data
Mozambique GHG emissions and CO2 emissions
In its updated NDC (2021), Mozambique defines a GHG emissions reduction target of 40 MtCO2eq between 2020 and 2025 compared to a BaU scenario. The target is conditional on financial assistance, estimated at around US$7.5bn, and technology transfer.
The National Strategy for Mitigation and Adaptation to Climate Change 2013-2025 (ENAMMC, 2012) aims to reduce vulnerability to climate change and improve the population's living conditions.
Source: Mozambique energy report
Interactive Chart Mozambique CO2 emissions
Source: Global Energy & CO2 data
Benefit from up to 2 000 up-to-date data series for 186 countries in Global Energy & CO2 data
View the detailed consumption trends at country level (graphs, tables, analysis) in the Mozambique energy report