
- Update
-
- Format
- 3 files (PDF report, 2 Excel files)
- Pages
-
59 (Report only)
- Delivery
- Immediate by e-mail
- GENERAL OVERVIEW
- ENERGY AND CLIMATE POLICY FRAMEWORK
- ENERGY COMPANIES
- ENERGY SUPPLY AND DEMAND
- ENERGY USE AND PRICE BY SECTOR
- ISSUES AND PROSPECTS
- STATISTICS
- ABBREVIATIONS
- GLOSSARY
Buy Mozambique energy report
Price without VAT. Depending on your status and location, VAT might be applicable. Get in touch with us for more information.
After validation, you will immediately receive 3 files by email (one pdf report and 2 excel files containing the datasets).
Overview
Mozambique’s energy strategy prioritises universal electrification by 2030, expanding hydropower and renewables while leveraging vast gas reserves. Key institutions regulate sectors, with EDM leading electricity and ENH overseeing hydrocarbons, as the nation advances LNG exports and green industrialisation.
Get more details on the table of contents and data files, as well as the list of graphs and tables by browsing the tabs below.
Highlights
- By 2030, the government aims to reach an electrification rate of 100%, up from 60% in 2024, and double its hydropower capacity. The country targeted to reduce GHG emissions of 40 MtCO2eq between 2020 and 2025 under condition of international support.
- EDM dominates power generation (70% of total production) and is responsible for electricity transmission and distribution. Eni, ExxonMobil, and TotalEnergies are the concessionaires of the largest deep water offshore gas blocks.
- The country has huge offshore natural gas resources that could turn the country into a large LNG exporter. The first LNG export terminal started operating in 2022. Hydro represents over 80% of the electricity mix, since coal production is exported.
- Per capita energy consumption is very low. Biomass is the main energy source (64%).
- Electricity prices are subsidized since 2012 because of the increasing cost of supply due to expensive gas-based power generation from IPPs.
- Around 10 GW are currently under development.
- The country intends to become a major gas player through the exploitation of its significant reserves.
Energy & Climate Policy Framework
MIREME, Ministry of Mineral Resources and Energy is responsible for the overall policy and institutional and regulatory framework, as well as setting energy targets and strategies.
The Instituto Nacional das Minas (INAMI) regulates all activities related to the exploration of mines. It replaced the Instituto Geológico Mineiro (IGM) in 2015.
Energy Companies
Gas:
ENH is also involved in gas production projects through its subsidiaries.
ENH Energy Trading (ENH 51%, Vitol 49%) markets LNG, LPG, and condensate.
Energy Supply & Demand
Resources:
Mozambique owns large energy resources. The country has a large hydro potential, estimated at 18.6 GW, with 5.6 GW presenting technical and economic feasibility. It is mainly located in the Zambezi Valley, which includes the existing Cahora Bassa Dam.
Energy Use and Price by Sector
Energy Prices in Industry:
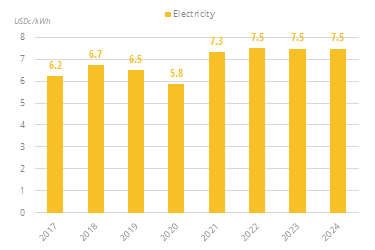
After a significant increase between 2020 and 2021 (+25%), electricity prices for industry have remained stable at around US$7.5c/kWh (including taxes).
Graph: Energy Prices Including Taxes in Industry (USDc/kWh GCV)
Issues & Prospects
Electricity:
Electricity is expected to become the core of the country's energy system, according to Mozambique's Energy Transition Strategy. To meet the increasing electricity demand, the country intends to develop its power capacity, mainly through additional hydropower, gas-fired and renewable plants, and to decrease the share of biomass in its mix.
- Graph 1: Primary Consumption Trends by Energy Source (Mtoe)
- Graph 2: Total Consumption Market Share by Energy (2023, %)
- Graph 3: Installed Electric Capacity by Source (GW)
- Graph 4: Installed Electric Capacity by Source (2023, %)
- Graph 5: Gross Power Production by Source & Consumption (TWh)
- Graph 6: Power Generation by Source (2023, %)
- Graph 7: Petroleum Products Production & Consumption (Mt)
- Graph 8: Gas Production & Consumption (bcm)
- Graph 9: Coal Production & Consumption (Mt)
- Graph 10: GHG Emissions and CO2-energy Emissions (MtCO2)
- Graph 11: Final Demand Trends by Energy Source (Mtoe)
- Graph 12: Final Consumption by Sector (Mtoe)
- Graph 13: Final Consumption Market Share by Sector (2023, %)
- Graph 14: Final Consumption in Industry by Energy Source (Mtoe)
- Graph 15: Energy Prices Including Taxes in Industry (USDc/kWh GCV)
- Graph 16: Final Consumption in Transport by Energy Source (Mtoe)
- Graph 17: Energy Prices Including Taxes in Transport (USD/l)
- Graph 18: Final Consumption in Residential, Services, Agriculture by Energy Source (Mtoe)
- Graph 19: Energy Prices Including Taxes in Residential (USDc/kWh GCV)
- Graph 20: Upcoming New Capacity by Energy Source (GW)
- Economic Indicators: Annual historical data including population, GDP growth, imports and exports, inflation rate, energy security and efficiency indicators, CO2 emissions.
- Supply Indicators: Historical data including oil and gas reserves, electric and refining capacity, energy production, power production and external trade. All are detailed by energy source.
- Demand Indicators: Historical data including consumption per inhabitant, consumption trends, total consumption by energy source, final consumption by energy source and sector, and electricity consumption by sector.
- Energy Balances: Single table displaying the overall energy industry balance per annum, also graphically displayed by energy sub-segment.
The Mozambique energy market data since 1990 and up to
is included in the Excel file accompanying the Mozambique country report.
It showcases the historical evolution, allowing users to easily work with the data.
Key Data included in the excelsheet:
- Economic indicators: Annual historical economic indicators, energy security, energy efficiency and CO2 emissions.
- Supply indicators: Annual historical reserves, capacity, production and external trade (imports(+) exports(-) balance).
- Demand indicators: Annual historical consumption per capita, consumption trends, total consumption, final consumption (per energy and per sector) and electricity consumption total and per sector.
- Energy Balance: total and per energy.
- Mozambique Energy Prices: In addition to the analysis provided on the report we also provided a data set which includes historical details on the Mozambique energy prices for the follow items: price of premium gasoline (taxes incl.), price of diesel (taxes incl.), price of electricity in industry (taxes incl.), price of electricity for households (taxes incl.), price of natural gas in industry (taxes incl.), prices of natural gas for households (taxes incl.), spot price of Brent and CO2 emissions (from fuel combustion).