Mexico Key Figures
- Population:
- 131 million
- GDP growth rate:
- 1.45 %/year
- Energy independence:
- 82.2%
Data of the last year available: 2024
- Total consumption/GDP:*
- 77.3 (2005=100)
- CO2 Emissions:
- 3.04 tCO2/capita
- Rate of T&D power losses:
- 12.4%
* at purchasing power parity
View all macro and energy indicators in the Mexico energy report
Mexico Energy News
View all news, archive your new and create your own daily newsletters only on your topics/countries of interest with Key Energy Intelligence
Mexico Energy Research
Benefit from up to 2 000 up-to-date data series for 186 countries in Global Energy & CO2 data
A data overview is available in the global energy statistics app
Mexico Total Energy Production & Consumption
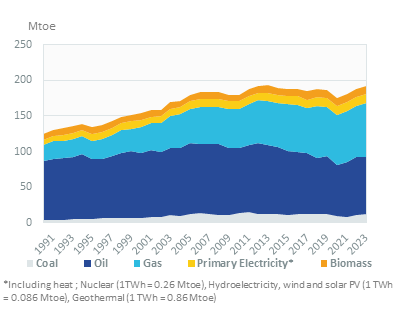
Total energy consumption per capita is 1.4 toe and electricity consumption per capita reached around 2 500 kWh (2024).
Total energy consumption increased by around 3%/year on average from 2020 to 2023, and remained stable in 2024 (186 Mtoe). Previously, it had been decreasing slightly over 2013-2019 (by 0.5%/year) and dropped by 6.5% in 2020 with the COVID pandemic.
Graph: CONSUMPTION TRENDS BY ENERGY SOURCE (Mtoe)
Source: Mexico energy report
Interactive Chart Mexico Total Energy Production & Consumption
Source: Global Energy & CO2 data
Benefit from up to 2 000 up-to-date data series for 186 countries in Global Energy & CO2 data
View the detailed fondamentals of the market at country level (graphs, tables, analysis) in the Mexico energy report
Mexico Oil Production & Consumption
Oil production has been roughly stable at around 95 Mt since 2019 (93 Mt in 2024). Previously, it had been falling rapidly since peaking at 191 Mt in 2004 (-4.6%/year). Approximately 70% of the production is extracted in the Bay of Campeche, in the south of the Gulf of Mexico (offshore). Mexico's sliding oil production is mainly explained by the decline of the Cantarell field (from 2 mb/d in 2004 to 0.16 mb/d in 2018 and no production since 2019). Around half of the production is exported (44% in 2024).
Source: Mexico energy report
Interactive Chart Mexico Crude Oil Production & Consumption
Source: Global Energy & CO2 data
Interactive Chart Mexico Refined Oil Products Production & Consumption
Source: Global Energy & CO2 data
Benefit from up to 2 000 up-to-date data series for 186 countries in Global Energy & CO2 data
Additionally, for more detailed information on refineries, you can request a sample of our America Refineries Dataset
Mexico Natural Gas Production & Consumption
Gas demand has been increasing by 2%/year on average since 2010 to 91 bcm. It increased more rapidly between 2000 and 2010 (around 4%/year) with the commissioning of numerous gas power plants.
Graph: NATURAL GAS CONSUMPTION (bcm)
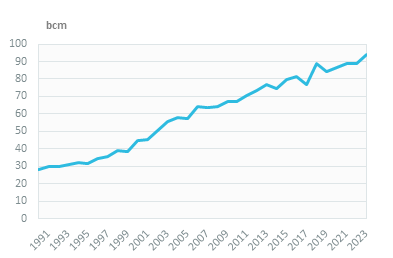
About 60% of gas demand is used for power production, 30% by the oil and gas sector, and 12% by industry (2024). Gas use in buildings (residential and services) remains marginal (1%).
Source: Mexico energy report
Interactive Chart Mexico Gas Production & Consumption
Source: Global Energy & CO2 data
Benefit from up to 2 000 up-to-date data series for 186 countries in Global Energy & CO2 data
Additionally, for more detailed information on the LNG trade, you can request a sample of our America LNG Trade Dataset
Mexico Coal and Lignite Production & Consumption
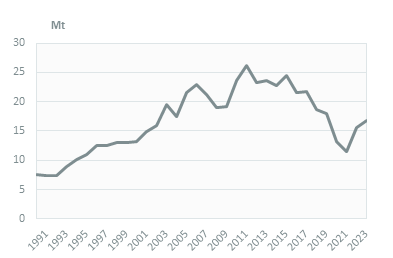
The demand for coal decreased by 6%/year over 2022-2024 to 13.6 Mt, after a 34% rebound in 2022. It decreased rapidly over 2011-2018 (-4.5%/year on average), with more striking reductions in 2020 (-27%) and 2021 (-12%).
Power generation absorbs three quarters of the coal consumption since 2022.
Graph: COAL CONSUMPTION (Mt)
Graph: COAL CONSUMPTION BREAKDOWN BY SECTOR (2024, %)
Source: Mexico energy report
Interactive Chart Mexico Coal and Lignite Production & Consumption
Source: Global Energy & CO2 data
Benefit from up to 2 000 up-to-date data series for 186 countries in Global Energy & CO2 data
View the detailed consumption trends at country level (graphs, tables, analysis) in the Mexico energy report
Mexico Power Production & Consumption
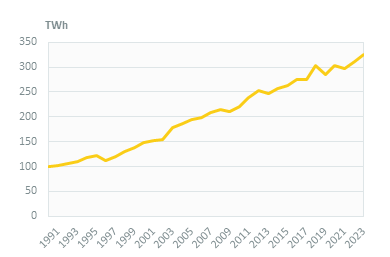
Electricity consumption has been increasing by around 2.5%/year on average since 2013, reaching 319 TWh in 2024.
The share of industry in electricity consumption is very high (65% in 2024), partly because large commercial buildings are included in industry. They are followed by households (23%) and services (6%). About 99% of the population is connected to the grid.
Graph: ELECTRICITY CONSUMPTION (TWh)
Source: Mexico energy report
Interactive Chart Mexico Power Production & Consumption
Source: Global Energy & CO2 data
Benefit from up to 2 000 up-to-date data series for 186 countries in Global Energy & CO2 data
View the detailed consumption trends at country level (graphs, tables, analysis) in the Mexico energy report
Mexico Renewable in % Electricity Production
The General Law on Climate Change set the target of a 35% share for "clean energies" (renewables, nuclear, CHP, and CCS) in total power generation in 2024, which was not reached (27% in 2024); the target was set at 37.7% in 2030, and 50% in 2050. SENER expects to reach a share of 50% earlier, in 2034. In 2024, the government announced its plan to increase the share of renewables in the power mix to 45% by 2030 (20.5% in 2024).
Source: Mexico energy report
Interactive Chart Mexico Share of Renewables in Electricity Production (incl hydro)
Source: Global Energy & CO2 data
Benefit from up to 2 000 up-to-date data series for 186 countries in Global Energy & CO2 data
Mexico GHG emissions and CO2 emissions
In its updated NDC (2022), the country increased its unconditional GHG emissions reduction target to 35% by 2030 compared to BAU levels (a reduction of 347 MtCO2eq). National resources will account for at least 30%, while 5% will be covered by international cooperation and planned clean energy financing. Emissions of black carbon should be cut by 51% below BAU by 2030. Mexico could raise its emission reduction targets to 40% (black carbon emissions to 70%) conditional to international support and financing.
Source: Mexico energy report
Interactive Chart Mexico CO2 emissions
Source: Global Energy & CO2 data
Benefit from up to 2 000 up-to-date data series for 186 countries in Global Energy & CO2 data
View the detailed consumption trends at country level (graphs, tables, analysis) in the Mexico energy report