Mauritania Key Figures
- Population:
- 5.02 million
- GDP growth rate:
- 6.51 %/year
- Energy independence:
- 25.5%
Data of the last year available: 2023
- Total consumption/GDP:*
- 115 (2015=100)
- CO2 Emissions:
- 1.00 tCO2/cap
- Rate of T&D power losses:
- 10.0%
* at purchasing power parity
View all macro and energy indicators in the Mauritania energy report
Mauritania Energy News
View all news, archive your new and create your own daily newsletters only on your topics/countries of interest with Key Energy Intelligence
Mauritania Energy Research
- Mauritania's Energy & Climate Policy Framework: Mauritania aims for 11% GHG reduction by 2030, 50% renewables in power mix, and a 2025 carbon tax. Key ministries oversee energy and environmental policies, with reforms in electricity and oil sectors, and targets for rural electrification and green hydrogen development.
- Mauritania's Energy Companies: Somelec dominates Mauritania's power sector, handling 80% of generation, transmission, and distribution. Afriquia acquired TotalEnergies' downstream assets. BP leads gas production at the GTA field, with exports starting in 2025.
- Mauritania's Energy Supply & Demand: Mauritania's energy sector has seen significant growth, with renewables rising to 16% of the power mix. Energy consumption has doubled since 2010, driven by oil (72%) and declining biomass use. Electricity capacity has tripled, with oil, wind, and solar as key sources. Gas exports began in 2025, while CO2 emissions have surged, largely from energy combustion and agriculture.
- Mauritania's Energy Use & Price by Sector: Final energy demand in Mauritania has surged since 2010, with households and services leading consumption (38%), followed by transport (36%) and industry (24%). Oil dominates industry and transport, while biomass, oil, and electricity share residential demand. Energy prices have generally declined, with notable drops in transport fuel and industrial electricity costs.
- Mauritania's Issues & Prospects: Mauritania is expanding its energy sector with gas, green hydrogen, and uranium projects, including a second phase of the GTA gas project and significant green hydrogen initiatives. The government aims to boost electricity capacity to meet rising demand and export power to neighbouring countries.
Benefit from up to 2 000 up-to-date data series for 186 countries in Global Energy & CO2 data
A data overview is available in the global energy statistics app
Mauritania Total Energy Production & Consumption
Energy consumption per capita is estimated at 0.5 toe in 2023 (compared to 0.3 toe in Mali and Senegal and 0.6 toe in Morocco).
Total energy consumption is growing rapidly and has more than doubled since 2010 (6%/year), reaching 2 Mtoe in 2023.
Oil covers 72% of the country's energy needs in 2023 (+14 points compared to 2010), biomass 20% (-15% points), and primary electricity (mainly solar, stable at 8%).
Graph: Primary Consumption Trends by Energy Source (Mtoe)
Source: Mauritania energy report
Interactive Chart Mauritania Total Energy Production & Consumption
Source: Global Energy & CO2 data
Benefit from up to 2 000 up-to-date data series for 186 countries in Global Energy & CO2 data
View the detailed fondamentals of the market at country level (graphs, tables, analysis) in the Mauritania energy report
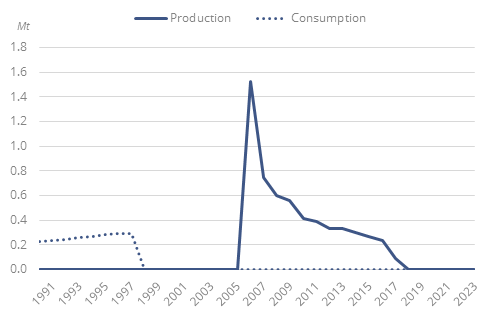
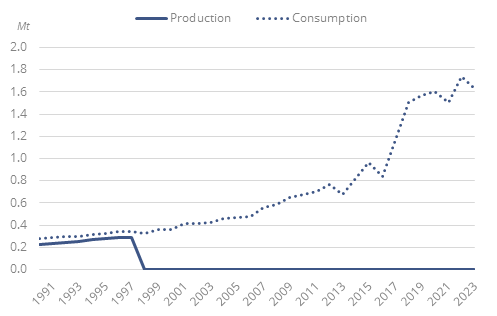
Mauritania Oil Production & Consumption
Crude oil production stopped in 2017 after the Chinguetti field moved to the decommissioning phase.
Graph: Crude Oil Production & Consumption (Mt)
Graph: Petroleum Products Production & Consumption (Mt)
Source: Mauritania energy report
Interactive Chart Mauritania Crude Oil Production & Consumption
Source: Global Energy & CO2 data
Interactive Chart Mauritania Refined Oil Products Production & Consumption
Source: Global Energy & CO2 data
Benefit from up to 2 000 up-to-date data series for 186 countries in Global Energy & CO2 data
Additionally, for more detailed information on refineries, you can request a sample of our EMEA Refineries Dataset
Mauritania Natural Gas Production & Consumption
Mauritania started producing gas at the Greater Tortue Ahmeyim (GTA) natural gas field at the end of 2024; all the gas produced is liquefied for exports. LNG exports startedin April 2025.
BP has signed a 20-year lease and operating agreement with Golar LNG for a floating LNG plant, Greater Tortue Ahmeyim LNG, with a capacity of 2.5 Mt/year. In 2020, Kosmos Energy signed a 20-year sale and purchase agreement with BP to supply the whole capacity of the first phase of the project
Source: Mauritania energy report
Interactive Chart Mauritania Gas Production & Consumption
Source: Global Energy & CO2 data
Benefit from up to 2 000 up-to-date data series for 186 countries in Global Energy & CO2 data
Additionally, for more detailed information on the LNG trade, you can request a sample of our EMEA LNG Trade Dataset
Mauritania Renewable in % Electricity Production
The target set in the Poverty Reduction Strategy Paper (PRSP, 2011) for a 20% share of renewables in power production in 2020 was almost achieved (19%, of which 10% for solar and 9% for wind).
According to the country's NDC, renewables should account for 50% of Mauritania's power mix in 2030 (16% in 2023, including 8% of solar and 8% of wind).
Source: Mauritania energy report
Interactive Chart Mauritania Share of Renewables in Electricity Production (incl hydro)
Source: Global Energy & CO2 data
Benefit from up to 2 000 up-to-date data series for 186 countries in Global Energy & CO2 data
Mauritania GHG emissions and CO2 emissions
In its updated NDC, the country set a GHG emissions reduction target of 92% in 2030, compared to a BAU scenario. The reduction target is divided into an unconditional reduction target of 11% and a conditional target of 81%, almost reaching carbon neutrality by the end of the decade. Mauritania expects to attain net zero emissions by 2050 on its own resources.
Source: Mauritania energy report
Interactive Chart Mauritania CO2 emissions
Source: Global Energy & CO2 data
Benefit from up to 2 000 up-to-date data series for 186 countries in Global Energy & CO2 data
View the detailed consumption trends at country level (graphs, tables, analysis) in the Mauritania energy report