
- Update
- Format
- 3 files (PDF report, 2 Excel files)
- Pages
-
52 (Report only)
- Delivery
- Immediate by e-mail
- GENERAL OVERVIEW
- ENERGY AND CLIMATE POLICY FRAMEWORK
- ENERGY COMPANIES
- ENERGY SUPPLY AND DEMAND
- ENERGY USE AND PRICE BY SECTOR
- ISSUES AND PROSPECTS
- STATISTICS
- ABBREVIATIONS
- GLOSSARY
Buy Mauritania energy report
Price without VAT. Depending on your status and location, VAT might be applicable. Get in touch with us for more information.
After validation, you will immediately receive 3 files by email (one pdf report and 2 excel files containing the datasets).
Overview
Mauritania is advancing a comprehensive energy transition, targeting ambitious renewable deployment and emissions reductions while expanding its fossil fuel sector. The government aims for renewables to constitute half the power mix by 2030, supported by a new green hydrogen framework and carbon pricing. State-owned Somelec dominates electricity, though reforms seek to liberalise generation while maintaining its distribution monopoly. Gas exports from the Greater Tortue Ahmeyim field began in 2025, bolstering economic growth alongside planned uranium and hydrogen projects.
Get more details on the table of contents and data files, as well as the list of graphs and tables by browsing the tabs below.
Highlights
- The country targets an 11% reduction in GHG emissions by 2030 relative to a BAU scenario, with a 50% share of renewables in the power mix.
- The government has introduced a carbon tax in 2025.
- Somelec dominates power generation (80% share) and is responsible for transmission and distribution.
- Morocco's Afriquia has completed the acquisition of TotalEnergies' downstream business in the country.
- The share of renewables in the power mix rose from 0 to 16% over the last decade.
- The country is starting to interconnect its power system through the commissioning of a transmission line between Nouakchott and Nouadhibou.
- LNG exports started in April 2025.
- Final consumption is rising very rapidly (almost 7%/year since 2010).
- A second phase of the GTA gas project is currently under development.
- The country intends to become a large green hydrogen exporter with 110 GW under development.
Energy & Climate Policy Framework
The Ministry of Petroleum and Energy (Ministère du Pétrole et de l'Energie,) is responsible for the planning, elaboration, and implementation of the national energy policy. It also supervises the energy companies.
Energy Companies
Oil:
Petronas is the operator of the Chinguetti offshore field that stopped production in 2017. The decommissioning program started in 2018.
Energy Supply & Demand
Oil:
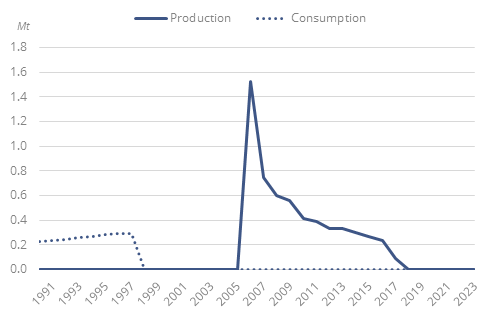
Crude oil production stopped in 2017 after the Chinguetti field moved to the decommissioning phase.
Graph: Crude Oil Production & Consumption (Mt)
Graph: Petroleum Products Production & Consumption (Mt)
Energy Use and Price by Sector
Energy Prices in Residential:
Household electricity prices are relatively stable since 2020, hovering around 6.7c/kWh, after falling by 20% in 2020. Energy tariffs do not allow the state to recover operating costs, contributing to Somelec's high deficits.
Residential electricity prices in Mauritania are about a third lower than in Morrocco and 3 times lower than in Senegal (2023).
Issues & Prospects
Electricity:
The Government plans to significantly increase power capacities to stop power outages, supply the future demand - which is expected to continue to rise sharply - and export electricity (to Senegal and Mali).
Graph: Upcoming New Capacity by Energy Source (GW)
- Graph 1: Primary Consumption Trends by Energy Source (Mtoe)
- Graph 2: Total Consumption Market Share by Energy (2023, %)
- Graph 3: Installed Electric Capacity by Source (GW)
- Graph 4: Installed Electric Capacity by Source (2023, %)
- Graph 5: Gross Power Production by Source & Consumption (TWh)
- Graph 6: Power Generation by Source (2023, %)
- Graph 7: Crude Oil Production & Consumption (Mt)
- Graph 8: Petroleum Products Production & Consumption (Mt)
- Graph 9: GHG Emissions and CO2-energy Emissions (MtCO2)
- Graph 10: Final Demand Trends by Energy Source (Mtoe)
- Graph 11: Final Consumption by Sector (Mtoe)
- Graph 12: Final Consumption Market Share by Sector (2023, %)
- Graph 13: Final Consumption in Industry by Energy Source (Mtoe)
- Graph 14: Energy Prices Including Taxes in Industry (USDc/kWh GCV)
- Graph 15: Final Consumption in Transport by Energy Source (Mtoe)
- Graph 16: Energy Prices Including Taxes in Transport (USD/l)
- Graph 17: Final Consumption in Residential, Services, Agriculture by Energy Source (Mtoe)
- Graph 18: Energy Prices Including Taxes in Residential (USDc/kWh GCV)
- Graph 19: Upcoming New Capacity by Energy Source (GW)
- Economic Indicators: Annual historical data including population, GDP growth, imports and exports, inflation rate, energy security and efficiency indicators, CO2 emissions.
- Supply Indicators: Historical data including oil and gas reserves, electric and refining capacity, energy production, power production and external trade. All are detailed by energy source.
- Demand Indicators: Historical data including consumption per inhabitant, consumption trends, total consumption by energy source, final consumption by energy source and sector, and electricity consumption by sector.
- Energy Balances: Single table displaying the overall energy industry balance per annum, also graphically displayed by energy sub-segment.
The Mauritania energy market data since 1990 and up to
is included in the Excel file accompanying the Mauritania country report.
It showcases the historical evolution, allowing users to easily work with the data.
Key Data included in the excelsheet:
- Economic indicators: Annual historical economic indicators, energy security, energy efficiency and CO2 emissions.
- Supply indicators: Annual historical reserves, capacity, production and external trade (imports(+) exports(-) balance).
- Demand indicators: Annual historical consumption per capita, consumption trends, total consumption, final consumption (per energy and per sector) and electricity consumption total and per sector.
- Energy Balance: total and per energy.
- Mauritania Energy Prices: In addition to the analysis provided on the report we also provided a data set which includes historical details on the Mauritania energy prices for the follow items: price of premium gasoline (taxes incl.), price of diesel (taxes incl.), price of electricity in industry (taxes incl.), price of electricity for households (taxes incl.), price of natural gas in industry (taxes incl.), prices of natural gas for households (taxes incl.), spot price of Brent and CO2 emissions (from fuel combustion).