Luxembourg Key Figures
- Population:
- 0.68 million
- GDP growth rate:
- 1.03 %/year
- Energy independence:
- 12.4%
Data of the last year available: 2024
- Total consumption/GDP:*
- 47.3 (2015=100)
- CO2 Emissions:
- 9.21 tCO2/cap
- Rate of T&D power losses:
- 1.90%
* at purchasing power parity
View all macro and energy indicators in the Luxembourg energy report
Luxembourg Energy News
View all news, archive your new and create your own daily newsletters only on your topics/countries of interest with Key Energy Intelligence
Luxembourg Energy Research
- Luxembourg's Energy & Climate Policy Framework: Luxembourg aims to achieve 37% renewable energy by 2030 and reduce GHG emissions by 55%. The government oversees energy and climate policies, promoting market liberalisation, energy efficiency, and low-carbon options. Support mechanisms include feed-in tariffs and auctions for renewables, while smart meters and a CO2 tax aid climate mitigation efforts.
- Luxembourg's Energy Companies: Encevo dominates Luxembourg's energy sector, operating key firms like Enovos, LEO, and Creos. SEO manages major power plants, while Soler leads renewable projects. Creos oversees transmission and distribution, with Enovos leading supply markets. Gas is solely imported by Enovos, with Creos handling transmission and three firms managing distribution.
- Luxembourg's Energy Supply & Demand: Luxembourg heavily relies on energy imports, with 97% of electricity imported and 80% of production from renewables. Primary energy consumption has declined since 2019, driven by reduced steel production and tourism. The country's per capita consumption remains high, at twice the EU average. Electricity generation has increased, with renewables accounting for 98% in 2024.
- Luxembourg's Energy Use & Price by Sector: Since 2019, final energy consumption has declined by 5% annually, with transport accounting for half of demand. Industrial electricity prices surged 67% in 2023, while fuel prices rose 8% yearly since 2020.
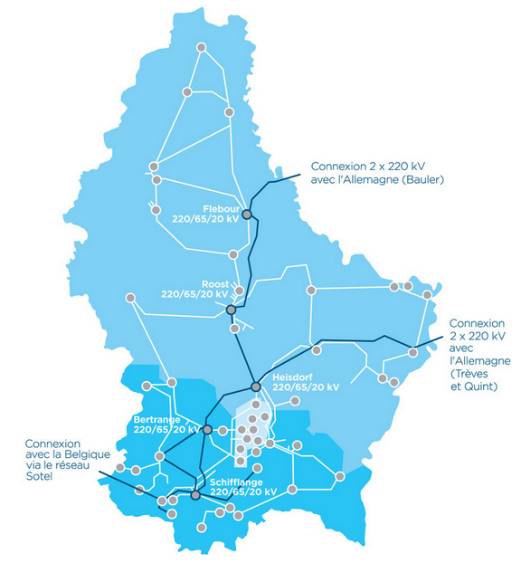
- Luxembourg's Issues & Prospects: Luxembourg is enhancing electricity interconnections with neighbouring countries and advancing wind energy projects, while participating in regional offshore wind initiatives.
Benefit from up to 2 000 up-to-date data series for 186 countries in Global Energy & CO2 data
A data overview is available in the global energy statistics app
Luxembourg Total Energy Production & Consumption
Primary energy consumption has been decreasing rapidly since 2019 (-4%/year) with an important decrease in 2022 (-12%). It fluctuated around 4 Mtoe from 2010 to 2019. The country's consumption per capita was 4.6 toe in 2024, which is around twice the EU average. Part of this high consumption is linked to steel production and to fuel tourism for motor fuels.
Graph: Primary Consumption Trends by Energy Source
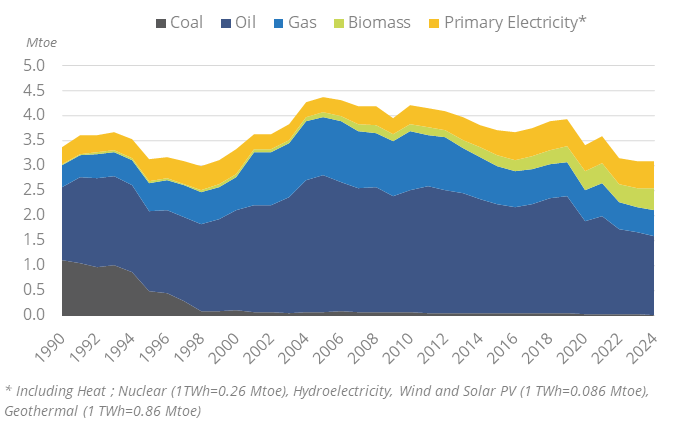
Source: Luxembourg energy report
Interactive Chart Luxembourg Total Energy Production & Consumption
Source: Global Energy & CO2 data
Benefit from up to 2 000 up-to-date data series for 186 countries in Global Energy & CO2 data
View the detailed fondamentals of the market at country level (graphs, tables, analysis) in the Luxembourg energy report
Luxembourg Oil Production & Consumption
Oil products are mainly imported from Belgium and have amounted to around 2.3 Mt since 2024.
Oil product consumption decreased by 6% to 1.5 Mt in 2024, after a 13% drop in 2023 and a 7% rebound in 2021. It increased by 2.5%/year between 2016 and 2019 to 2.3 Mt.
Graph: Petroleum Products Production & Consumption
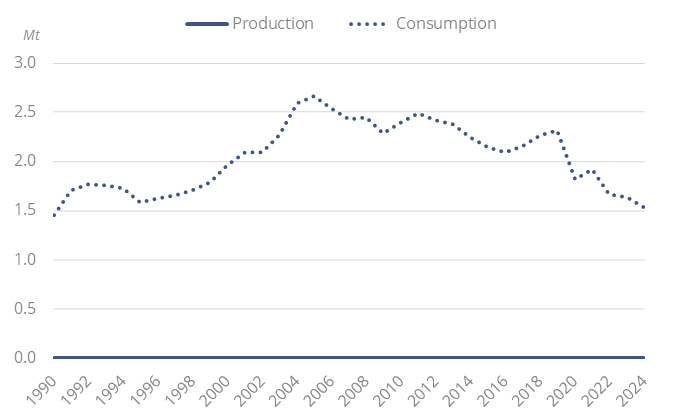
Source: Luxembourg energy report
Interactive Chart Luxembourg Crude Oil Production & Consumption
Source: Global Energy & CO2 data
Interactive Chart Luxembourg Refined Oil Products Production & Consumption
Source: Global Energy & CO2 data
Benefit from up to 2 000 up-to-date data series for 186 countries in Global Energy & CO2 data
Additionally, for more detailed information on refineries, you can request a sample of our EMEA Refineries Dataset
Luxembourg Natural Gas Production & Consumption
Luxembourg imports gas from Belgium and Germany through 4 interconnection points (around 0.6 bcm since 2022). In 2024100% of gas was imported from Belgium. From 2012 to 2022, gas imports and consumption decreased by 7%/year, mainly because of the low utilisation of the CCGT power plant and its definitive closure in 2016. In 2024, households and services consumed 60% of the gas, followed by industry (36%) and power plants (3%, vs. 42% in 2012).
Source: CREOS
Source: Luxembourg energy report
Interactive Chart Luxembourg Gas Production & Consumption
Source: Global Energy & CO2 data
Benefit from up to 2 000 up-to-date data series for 186 countries in Global Energy & CO2 data
Additionally, for more detailed information on the LNG trade, you can request a sample of our EMEA LNG Trade Dataset
Luxembourg Coal and Lignite Production & Consumption
Coal, which was used in the iron and steel industry, completely disappeared from the country's energy mix (1%).
Graph: Coal Production & Consumption
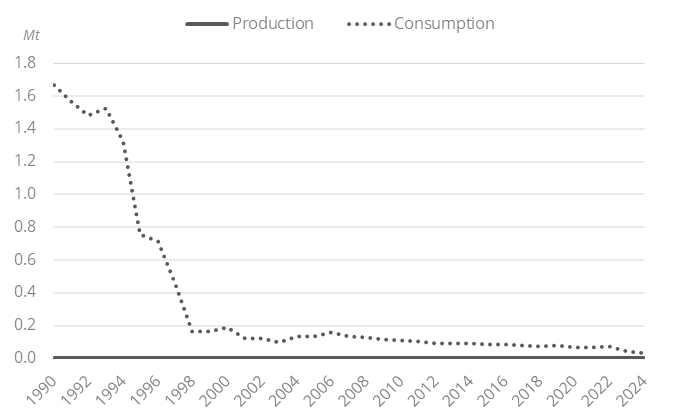
Source: Luxembourg energy report
Interactive Chart Luxembourg Coal and Lignite Production & Consumption
Source: Global Energy & CO2 data
Benefit from up to 2 000 up-to-date data series for 186 countries in Global Energy & CO2 data
View the detailed consumption trends at country level (graphs, tables, analysis) in the Luxembourg energy report
Luxembourg Renewable in % Electricity Production
Luxembourg aims to increase the share of renewables in final energy consumption to 37% in 2030, including 40.3% for heating, 39.1% for electricity, and 27% for transport. In 2023, this share reached 18.0% (15.5% for heating, 18.0% for electricity, and 9.2% for transport).
To achieve its 2030 target, Luxembourg intends to use cooperation mechanisms already in place with the others EU countries to statistically buy a part of their renewable energy production. Since 2018, tenders have been implemented for solar projects.
Source: Luxembourg energy report
Interactive Chart Luxembourg Share of Renewables in Electricity Production (incl hydro)
Source: Global Energy & CO2 data
Benefit from up to 2 000 up-to-date data series for 186 countries in Global Energy & CO2 data
Learn more about renewables in the European Battery Market Analysis
Luxembourg GHG emissions and CO2 emissions
Luxembourg aims to reduce its GHG emissions by 55% in 2030 compared to 2005.
Source: Luxembourg energy report
Interactive Chart Luxembourg CO2 emissions
Source: Global Energy & CO2 data
Benefit from up to 2 000 up-to-date data series for 186 countries in Global Energy & CO2 data
View the detailed consumption trends at country level (graphs, tables, analysis) in the Luxembourg energy report