
- Update
- Format
- 3 files (PDF report, 2 Excel files)
- Pages
-
49 (Report only)
- Delivery
- Immediate by e-mail
- GENERAL OVERVIEW
- ENERGY AND CLIMATE POLICY FRAMEWORK
- ENERGY COMPANIES
- ENERGY SUPPLY AND DEMAND
- ENERGY USE AND PRICE BY SECTOR
- ISSUES AND PROSPECTS
- STATISTICS
- ABBREVIATIONS
- GLOSSARY
Buy Luxembourg energy report
Price without VAT. Depending on your status and location, VAT might be applicable. Get in touch with us for more information.
After validation, you will immediately receive 3 files by email (one pdf report and 2 excel files containing the datasets).
Overview
Luxembourg is advancing its energy transition with ambitious targets to achieve 37% renewable energy in final consumption and a 55% reduction in greenhouse gas emissions by 2030. The country prioritises decarbonisation, energy efficiency, and market liberalisation while maintaining a secure, competitive supply. Key measures include expanding renewables, enhancing grid interconnections, and implementing carbon pricing.
Get more details on the table of contents and data files, as well as the list of graphs and tables by browsing the tabs below.
Highlights
- Luxembourg aims to reach a share of 37% of renewables in its final energy consumption in 2030 and to reduce its GHG emissions by 55%.
- Encevo is the dominant energy company.
- SEO operates the largest power plant.
- Almost the totality of the electricity consumed (97%) is imported. The electricity produced (80%) is mostly coming from renewables.
- Final energy consumption at normal climate decreased by 5%/year since 2019.
- Gasoline and diesel prices have increased by around 8%/year since 2020.
- Electricity prices in industry have almost tripled from 2021 to 2023.
- Luxembourg plans to develop electricity interconnections with Belgium, Germany, and France.
Energy & Climate Policy Framework
The Ministry of Energy and Spatial Planning, through its Department of Energy, is responsible for the energy sector.
The Ministry of Environment, Climate, and Biodiversity oversees greenhouse gas (GHG) emission reduction policies.
The Luxembourg Institute of Regulation (ILR) regulates the electricity and gas markets.
Energy Companies
Electricity:
SEO, Société Electrique de l'Our (Luxembourg State and RWE 40.4% each), operates the Vianden pumped storage plant (1 291 MW) and 47 MW of run-of-river plants.
Soler (50% SEO, 50% Enovos) is the largest company developing renewable projects. In 2024, it operates 156 MW of wind power plants and 20 MW of hydropower plants.
Energy Supply & Demand
Resources:
Since it has no energy resources, the country imports almost all its needs; it produces a limited amount of electricity (from hydro, wind, and waste).
Energy Use and Price by Sector
Energy Prices in Residential:
The general VAT rate increased in 2015 from 15% to 17%. A reduced rate of 8% applies for electricity, natural gas, and LPG and of 14% for heating oil.
From January 2023 to December 2023, all VAT rates were reduced by 1% to 16% for general VAT, 7% for electricity, natural gas and LPG, and 13% for heating oil. Since 1 January 2024, the VAT rates have gone back to normal (17%).
Issues & Prospects
Electricity:
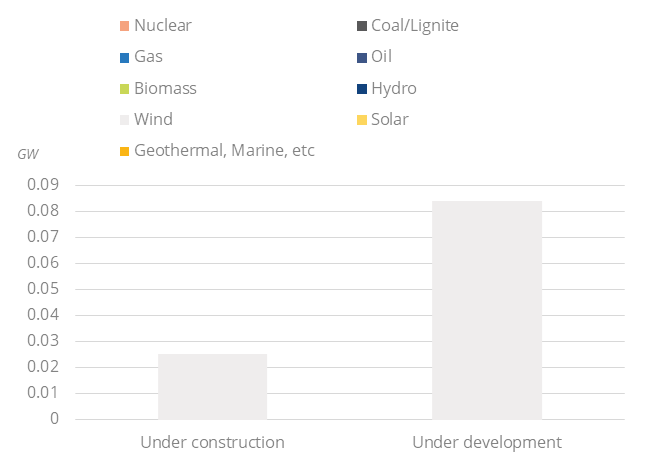
Limited projects are underway (30 MW of wind projects under construction and 80 MW under development).
Graph: Upcoming New Capacity by Energy Source
- Graph 1: Primary Consumption Trends by Energy Source
- Graph 2: Total Consumption Market Share by Energy (2024)
- Graph 3: Installed Electric Capacity by Source
- Graph 4: Installed Electric Capacity by Source (2024)
- Graph 5: Gross Power Production by Source & Consumption
- Graph 6: Power Generation by Source (2024)
- Graph 7: Petroleum Products Production & Consumption
- Graph 8: Gas Production & Consumption
- Graph 9: Coal Production & Consumption
- Graph 10: Emissions of GHG and CO2 from Fuel Combustion
- Graph 11: Final Demand Trends by Energy Source
- Graph 12: Final Consumption by Sector
- Graph 13: Final Consumption Market Share by Sector (2024)
- Graph 14: Final Consumption in Industry by Energy Source
- Graph 15: Energy Prices in Industry (Taxes Included)
- Graph 16: Final Consumption in Transport by Energy Source
- Graph 17: Energy Prices in Transport (Taxes Included)
- Graph 18: Final Consumption in Residential, Services, Agriculture by Energy Source
- Graph 19: Energy Prices in Residential (Taxes Included)
- Graph 20: Upcoming New Capacity by Energy Source
- Economic Indicators: Annual historical data including population, GDP growth, imports and exports, inflation rate, energy security and efficiency indicators, CO2 emissions.
- Supply Indicators: Historical data including oil and gas reserves, electric and refining capacity, energy production, power production and external trade. All are detailed by energy source.
- Demand Indicators: Historical data including consumption per inhabitant, consumption trends, total consumption by energy source, final consumption by energy source and sector, and electricity consumption by sector.
- Energy Balances: Single table displaying the overall energy industry balance per annum, also graphically displayed by energy sub-segment.
The Luxembourg energy market data since 1990 and up to
is included in the Excel file accompanying the Luxembourg country report.
It showcases the historical evolution, allowing users to easily work with the data.
Key Data included in the excelsheet:
- Economic indicators: Annual historical economic indicators, energy security, energy efficiency and CO2 emissions.
- Supply indicators: Annual historical reserves, capacity, production and external trade (imports(+) exports(-) balance).
- Demand indicators: Annual historical consumption per capita, consumption trends, total consumption, final consumption (per energy and per sector) and electricity consumption total and per sector.
- Energy Balance: total and per energy.
- Luxembourg Energy Prices: In addition to the analysis provided on the report we also provided a data set which includes historical details on the Luxembourg energy prices for the follow items: price of premium gasoline (taxes incl.), price of diesel (taxes incl.), price of electricity in industry (taxes incl.), price of electricity for households (taxes incl.), price of natural gas in industry (taxes incl.), prices of natural gas for households (taxes incl.), spot price of Brent and CO2 emissions (from fuel combustion).