Latvia Key Figures
- Population:
- 1.87 million
- GDP growth rate:
- -0.4 %/year
- Energy independence:
- 76.1%
Data of the last year available: 2024
- Total consumption/GDP:*
- 83.1 (2015=100)
- CO2 Emissions:
- 3.24 tCO2/cap
- Rate of T&D power losses:
- 9.63%
* at purchasing power parity
View all macro and energy indicators in the Latvia energy report
Latvia Energy News
View all news, archive your new and create your own daily newsletters only on your topics/countries of interest with Key Energy Intelligence
Latvia Energy Research
- Latvia's Energy & Climate Policy Framework: Latvia aims for 61% renewable energy by 2030, with the NECP 2021-2030 guiding energy efficiency, renewables, and CO2 reduction. The country has fully integrated into the EU's energy network, disconnecting from Russian and Belarusian grids. Gas market liberalisation occurred in 2017, and Latvia offers financial support for renewable energy transitions, though feed-in tariffs were suspended. Energy efficiency measures target a 42% reduction in consumption by 2030, with smart meters fully deployed. The NECP plans a 59% reduction in GHG emissions by 2030 compared to 1990.
- Latvia's Energy Companies: Latvenergo dominates Latvia's energy sector, leading in electricity generation, transmission, and distribution. Gas operations were unbundled, with Conexus Grid handling transmission and Gaso managing distribution. Oil infrastructure includes major terminals and numerous service stations.
- Latvia's Energy Supply & Demand: Latvia's energy mix relies heavily on biomass (39%) and hydropower (51%), with significant imports. Energy consumption is below EU average, and GHG emissions are decreasing. The country has limited domestic resources and depends on interconnections with neighbours for electricity and gas.
- Latvia's Energy Use & Price by Sector: Since 2015, final energy consumption has remained stable at around 4 Mtoe, with oil products being the largest energy source. Households and services account for 47% of consumption, followed by transport (27%) and industry (24%). Electricity and gas prices surged post-2020 but have since stabilised, with household electricity prices 20% above the EU average and gas prices below it.
- Latvia's Issues & Prospects: Latvia is upgrading hydropower plants and expanding gas infrastructure to boost energy supply. The NECP projects a 14% drop in energy consumption by 2030, with 100% renewable electricity. Offshore wind and interconnections are key initiatives, supported by the Baltic Offshore Grid Initiative. Solar and storage projects are also advancing, while coal projects are suspended.
Benefit from up to 2 000 up-to-date data series for 186 countries in Global Energy & CO2 data
A data overview is available in the global energy statistics app
Latvia Total Energy Production & Consumption
Energy consumption per capita is 2.3 toe, including 3 600 kWh of electricity, i.e. around 19% below the EU average (2024).
Graph: Primary Consumption Trends by Energy Source (Mtoe)
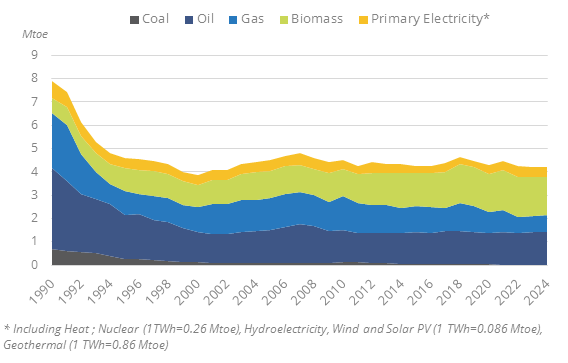
Since 2011, total energy consumption has fluctuated around 4.3 Mtoe (4.2 Mtoe in 2024).
Source: Latvia energy report
Interactive Chart Latvia Total Energy Production & Consumption
Source: Global Energy & CO2 data
Benefit from up to 2 000 up-to-date data series for 186 countries in Global Energy & CO2 data
View the detailed fondamentals of the market at country level (graphs, tables, analysis) in the Latvia energy report
Latvia Oil Production & Consumption
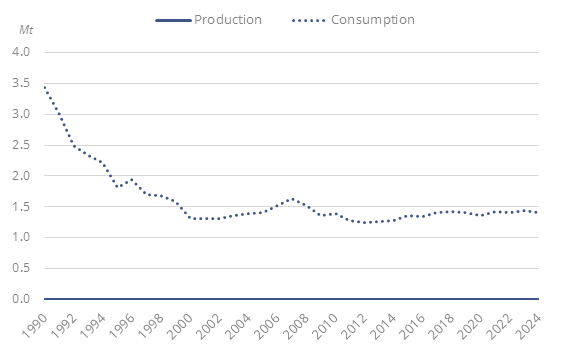
Latvia does not have a refinery. It imports all its refined products by rail and pipeline from the Lithuanian refinery of Mazeikiai and Finland. Oil product imports have increased by 6.7%/year since 2021 (2.3 Mt in 2024), after dipping by 7%/year between 2016 and 2021; imports in 2023 mainly came from Lithuania (50%), followed by Russia (20%) and Finland (=17%).
Graph: Petroleum Products Production & Consumption (Mt)
Source: Latvia energy report
Interactive Chart Latvia Crude Oil Production & Consumption
Source: Global Energy & CO2 data
Interactive Chart Latvia Refined Oil Products Production & Consumption
Source: Global Energy & CO2 data
Benefit from up to 2 000 up-to-date data series for 186 countries in Global Energy & CO2 data
Additionally, for more detailed information on refineries, you can request a sample of our EMEA Refineries Dataset
Latvia Natural Gas Production & Consumption
All gas is imported. Before a sharp -10%/year since 2021 to reach 0.9 bcm in 2024, imports had been fluctuating between 1.4 bcm in 2015 and 1.1 bcm in 2021. They fell by 44% in 2014 due to warm temperatures, but soared (+38%) in 2015, owing to a rising demand from the power sector and to lower extractions from the Inčukalns gas storage.
With the ban on Russian gas imports starting in January 2023, Lithuania has become the main gas supplier, accounting for nearly 100% of imports in 2023.
Source: Latvia energy report
Interactive Chart Latvia Gas Production & Consumption
Source: Global Energy & CO2 data
Benefit from up to 2 000 up-to-date data series for 186 countries in Global Energy & CO2 data
Additionally, for more detailed information on the LNG trade, you can request a sample of our EMEA LNG Trade Dataset
Latvia Coal and Lignite Production & Consumption
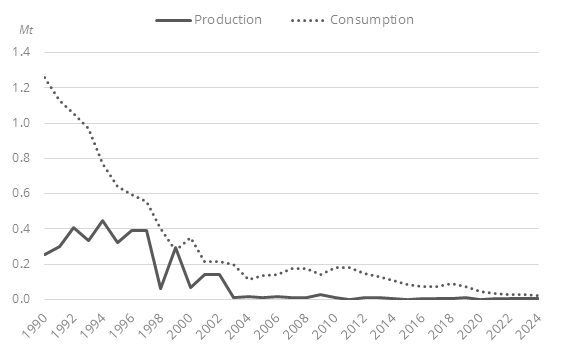
Coal and lignite consumption has fallen steadily since 2010 by 15%/year, after a tenfold decrease between 1990 and 2004 (reduced use for CHP and heat plants). It is now marginal in Latvia's energy mix (less than 1% and 27 kt in 2024).
Graph: Coal Production & Consumption (Mt)
Source: Latvia energy report
Interactive Chart Latvia Coal and Lignite Production & Consumption
Source: Global Energy & CO2 data
Benefit from up to 2 000 up-to-date data series for 186 countries in Global Energy & CO2 data
View the detailed consumption trends at country level (graphs, tables, analysis) in the Latvia energy report
Latvia Renewable in % Electricity Production
The NECP (2024) raised the share of renewables in the final energy consumption to 61% in 2030, including 73% for heat, 65% for buildings, and 29% for transport. These targets should be easily reached as, in 2023, the share of renewables was 43.2% (of which 54.3% for electricity, 61.4% for heat, and 1.4% in transport).
Latvia exceeded by 5 pp the target set by the European Directive for a 40% share of renewables in 2020 in the final consumption.
Source: Latvia energy report
Interactive Chart Latvia Share of Renewables in Electricity Production (incl hydro)
Source: Global Energy & CO2 data
Benefit from up to 2 000 up-to-date data series for 186 countries in Global Energy & CO2 data
Learn more about renewables in the European Battery Market Analysis
Latvia GHG emissions and CO2 emissions
The final version of NECP (2024) plans for a reduction of 59% by 2030 compared to 1990, including a 20.5% cut in emissions from non-ETS activities by 2030 (compared to 2005). In its NDC (2023), Latvia stated an objective of reducing GHG emissions by 17% in 2030 compared to 2005 levels.
Source: Latvia energy report
Interactive Chart Latvia CO2 emissions
Source: Global Energy & CO2 data
Benefit from up to 2 000 up-to-date data series for 186 countries in Global Energy & CO2 data
View the detailed consumption trends at country level (graphs, tables, analysis) in the Latvia energy report