Kenya Key Figures
- Population:
- 56.4 million
- GDP growth rate:
- 4.50 %/year
- Energy independence:
- 80.8%
Data of the last year available: 2024
- Total consumption/GDP:*
- 81.5 (2015=100)
- CO2 Emissions:
- 0.26 tCO2/cap
- Rate of T&D power losses:
- 22.8%
* at purchasing power parity
View all macro and energy indicators in the Kenya energy report
Kenya Energy News
View all news, archive your new and create your own daily newsletters only on your topics/countries of interest with Key Energy Intelligence
Kenya Energy Research
- Kenya's Energy & Climate Policy Framework: Kenya advances energy reforms: 76% electrification, 100% renewables by 2030, competitive markets, and carbon trading framework.
- Kenya's Energy Companies: KenGen dominates Kenya’s power sector, while NOCK and KPC undergo privatisation. GDC leads geothermal expansion.
- Kenya's Energy Supply & Demand: Kenya’s energy mix shifted significantly towards renewables, with geothermal, wind, and solar now comprising 61% of power generation, up from 21% in 2010.
- Kenya's Energy Use & Price by Sector: Final energy demand in Kenya is led by biomass (63%), with the residential-tertiary sector consuming 69%. Motor fuel prices rose nearly 50% since 2020.
- Kenya's Issues & Prospects: Kenya aims to triple power capacity by 2030, prioritising 100% clean energy via geothermal, wind, and solar expansion, while phasing out coal and advancing nuclear plans.
Benefit from up to 2 000 up-to-date data series for 186 countries in Global Energy & CO2 data
A data overview is available in the global energy statistics app
Kenya Total Energy Production & Consumption
Total energy consumption has increased by 1.5%/year since 2019, reaching 31 Mtoe in 2024, after growing by an average of 2.2%/year from 2010 to 2019. Total per capita energy consumption is around 0.55 toe (2024), 20% above the Sub-Saharan Africa average.
The share of biomass in total energy consumption decreased from 75% in 2010 to 64%in 2024, whereas the share of primary electricity (hydro, geothermal, and wind) rose from 8% in 2010 to 17% in 2024. The share of oil has decreased by 4 points since 2019 to 15% in 2024, while coal is marginal (4%).
Source: Kenya energy report
Interactive Chart Kenya Total Energy Production & Consumption
Source: Global Energy & CO2 data
Benefit from up to 2 000 up-to-date data series for 186 countries in Global Energy & CO2 data
View the detailed fondamentals of the market at country level (graphs, tables, analysis) in the Kenya energy report
Kenya Oil Production & Consumption
Kenya's energy landscape continues to evolve as the nation manages its four primary petroleum exploration basins: Lamu, Anza, Mandera, and Tertiary Rift. While Kenya has not yet reached the stage of commercial oil production, the infrastructure for its 63 petroleum blocks is actively being refined to attract global investment. Currently, 27 of these blocks are under license—with 26 held by 13 different international oil companies and one managed by the National Oil Corporation of Kenya (NOCK)—leaving 35 blocks open for future bidding.
Source: Kenya energy report
Interactive Chart Kenya Crude Oil Production & Consumption
Source: Global Energy & CO2 data
Interactive Chart Kenya Refined Oil Products Production & Consumption
Source: Global Energy & CO2 data
Benefit from up to 2 000 up-to-date data series for 186 countries in Global Energy & CO2 data
Additionally, for more detailed information on refineries, you can request a sample of our EMEA Refineries Dataset
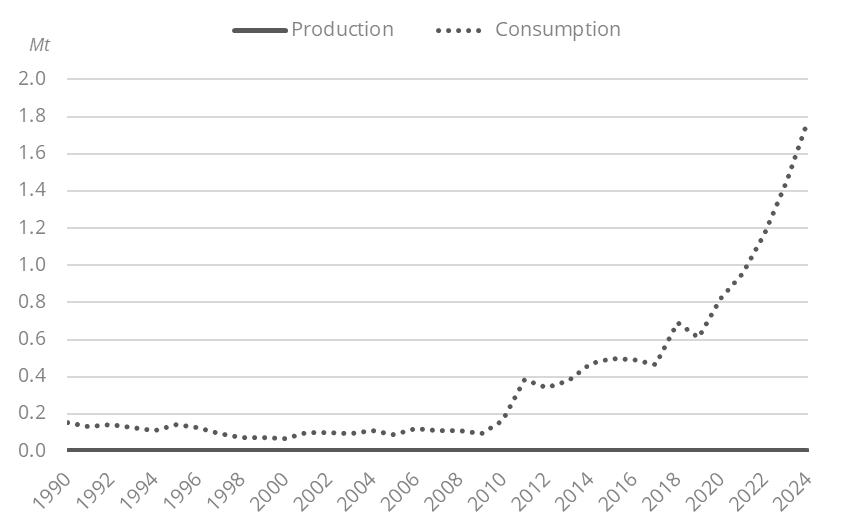
Kenya Coal and Lignite Production & Consumption
Since 2010, coal consumption has increased by an average of almost 20%/year, reaching 1.8 Mt in 2024; coal is only consumed in industry.
Graph: Coal Production & Consumption
Source: Kenya energy report
Interactive Chart Kenya Coal and Lignite Production & Consumption
Source: Global Energy & CO2 data
Benefit from up to 2 000 up-to-date data series for 186 countries in Global Energy & CO2 data
View the detailed consumption trends at country level (graphs, tables, analysis) in the Kenya energy report
Kenya Renewable in % Electricity Production
RERAC, the Renewable Energy Resources Advisory Committee established under the Energy Act (2019), advises the Cabinet Secretary on the management and development of renewable energy resources. Meanwhile, REREC (Rural Electrification and Renewable Energy Corporation) serves as the lead implementing agency for renewable energy projects—excluding geothermal and large hydro—with a primary focus on rural electrification and the expansion of the national green energy mix.
Source: Kenya energy report
Interactive Chart Kenya Share of Renewables in Electricity Production (incl hydro)
Source: Global Energy & CO2 data
Benefit from up to 2 000 up-to-date data series for 186 countries in Global Energy & CO2 data
Kenya GHG emissions and CO2 emissions
In its updated NDC (2020), the country set a GHG emissions reduction target of 32% in 2030 (30% previously), compared to a BaU scenario of 143 MtCO2e. To reach this target, Kenya commits to mobilise resources to meet 21% of the budget by bringing US$ 3.7bn and will require international support for the remaining 79% of the budget.
Source: Kenya energy report
Interactive Chart Kenya CO2 emissions
Source: Global Energy & CO2 data
Benefit from up to 2 000 up-to-date data series for 186 countries in Global Energy & CO2 data
View the detailed consumption trends at country level (graphs, tables, analysis) in the Kenya energy report