Kazakhstan Key Figures
- Population:
- 20.6 million
- GDP growth rate:
- 4.80 %/year
- Energy independence:
- 100%
Data of the last year available: 2024
- Total consumption/GDP:*
- 92.7 (2015=100)
- CO2 Emissions:
- 11.1 tCO2/cap
- Rate of T&D power losses:
- 14.2%
* at purchasing power parity
View all macro and energy indicators in the Kazakhstan energy report
Kazakhstan Energy News
View all news, archive your new and create your own daily newsletters only on your topics/countries of interest with Key Energy Intelligence
Kazakhstan Energy Research
- Kazakhstan's Energy & Climate Policy Framework: Kazakhstan aims for 50% renewable/alternative energy by 2050, with nuclear and green hydrogen key focus areas.
- Kazakhstan's Energy Companies: Kazakhstan’s energy sector is dominated by state-owned firms like Samruk-Energy (power), KMG (oil/gas), and Kazatomprom (uranium). Key players include TCO and NCOC in oil, with privatised electricity generation.
- Kazakhstan's Energy Supply & Demand: Kazakhstan: world’s top uranium producer; coal dominates energy mix (61% power); gas stable at 30 bcm; rising renewables.
- Kazakhstan's Energy Use & Price by Sector: Buildings dominate energy use (47%), with oil (35%) and gas (17%) key sources. Prices are regulated; gas and electricity remain low-cost. Industry’s energy demand halved since 2010, shifting to electricity. Transport relies almost entirely on oil (98%).
- Kazakhstan's Issues & Prospects: Kazakhstan advances energy projects: 40GW renewables, 2GW nuclear, and green hydrogen expansion by 2032.
Benefit from up to 2 000 up-to-date data series for 186 countries in Global Energy & CO2 data
A data overview is available in the global energy statistics app
Kazakhstan Total Energy Production & Consumption
Primary energy consumption dipped by 1.1% in 2024 to 72 Mtoe, returning to its 2019 level following an 8% decrease in 2020 and a rebound in 2021 and 2023. Before that, it reached a peak at over 80 Mtoe in 2011 and stabilised at around 70 Mtoe between 2015 and 2019.
Per capita consumption is about 3.5 toe (2024), which is 10% below the CIS average. It has declined by 1.9%/year since 2010. Overall, primary energy intensity has decreased by 4%/year since 2010, but it remains high.
Source: Kazakhstan energy report
Interactive Chart Kazakhstan Total Energy Production & Consumption
Source: Global Energy & CO2 data
Benefit from up to 2 000 up-to-date data series for 186 countries in Global Energy & CO2 data
View the detailed fondamentals of the market at country level (graphs, tables, analysis) in the Kazakhstan energy report
Kazakhstan Oil Production & Consumption
Oil production decreased by 2.7% in 2024 to 88 Mt, after averaging 86 Mt since 2020. The country's OPEC+ quota and voluntary cuts for 2024 amounted to 82 Mt in 2024.In March 2026, the OPEC+ set a required production level in the country of 1.6 mb/d (+10 kb/d) for April 2026.
Source: Kazakhstan energy report
Interactive Chart Kazakhstan Crude Oil Production & Consumption
Source: Global Energy & CO2 data
Interactive Chart Kazakhstan Refined Oil Products Production & Consumption
Source: Global Energy & CO2 data
Benefit from up to 2 000 up-to-date data series for 186 countries in Global Energy & CO2 data
Additionally, for more detailed information on refineries, you can request a sample of our EMEA Refineries Dataset
Kazakhstan Natural Gas Production & Consumption
Gas marketed production has averaged 30 bcm since 2020 (-2.6% to 30 bcm in 2024). It had increased fourfold between 2000 and 2018 (peak at 41 bcm) before falling by 12%/year until 2021 to 28 bcm and recovering until 2023 (+5%/year). According to preliminary estimates, gas production surged by over 15% in 2025, exceeding its target by 9%, thanks to the commissioning of the 1.5 bcm Barkhannaya field. Karachaganak accounted for 41% of the country's gross production in 2024, followed by Tengiz (26%) and Kashagan (19%).
Source: Kazakhstan energy report
Interactive Chart Kazakhstan Gas Production & Consumption
Source: Global Energy & CO2 data
Benefit from up to 2 000 up-to-date data series for 186 countries in Global Energy & CO2 data
Additionally, for more detailed information on the LNG trade, you can request a sample of our EMEA LNG Trade Dataset
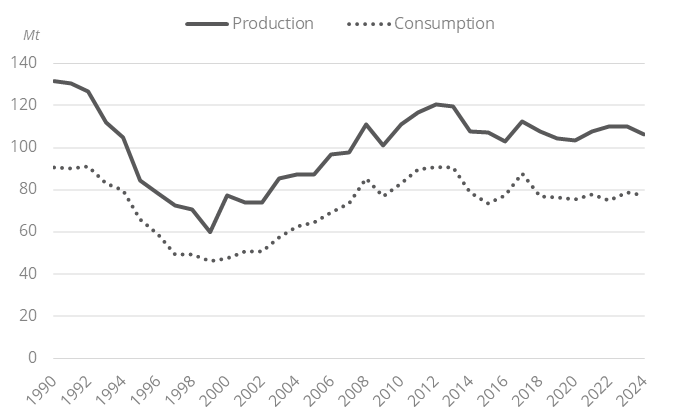
Kazakhstan Coal and Lignite Production & Consumption
Coal production decreased by 3% in 2024 to 106 Mt. It has been broadly stable at around 107 Mt since 2014. Coal production is mainly located in the Karaganda (13 mines) and Ekibastuz (3 mines) basins. Nearly 30% of the coal production is exported (27% in 2024).
Graph: Coal Production & Consumption
Source: Kazakhstan energy report
Interactive Chart Kazakhstan Coal and Lignite Production & Consumption
Source: Global Energy & CO2 data
Benefit from up to 2 000 up-to-date data series for 186 countries in Global Energy & CO2 data
View the detailed consumption trends at country level (graphs, tables, analysis) in the Kazakhstan energy report
Kazakhstan Renewable in % Electricity Production
According to the 2050 Strategy (2013), solar and wind were meant to account for 3% of the power mix by 2020 (2% reached in 2020) and about 10% by 2030 (5.4% reached in 2024).In 2021, the government raised the 2030 target to 15%. By 2050, the country aims to generate 50% of its power from "alternative (i.e. nuclear) or renewable sources". In September 2025, the government announced plans to build 6.3 GW of green energy capacity by 2030.
The National Programme of Wind Power Sector Development set wind a generation target of 5 TWh in 2024 (almost achieved with 4.5 TWh generated).
Source: Kazakhstan energy report
Interactive Chart Kazakhstan Share of Renewables in Electricity Production (incl hydro)
Source: Global Energy & CO2 data
Benefit from up to 2 000 up-to-date data series for 186 countries in Global Energy & CO2 data
Kazakhstan GHG emissions and CO2 emissions
Kazakhstan released its updated Nationally Determined Contribution (NDC 3.0)in November 2025. The NDC raises Kazakhstan's mitigation target, with national net greenhouse gas (GHG) emissions set to decline by 15% below 1990 levels by 2035 (unconditional target) and up to 25% with international support. Under the unconditional pathway, net GHG emissions would reach around 328 MtCO2eq in 2030 (-15% from 1990 level) and 320 MtCO2eq (-17%) by 2035. With international support, GHG emissions would fall to around 288 MtCO2e by 2035.
Source: Kazakhstan energy report
Interactive Chart Kazakhstan CO2 emissions
Source: Global Energy & CO2 data
Benefit from up to 2 000 up-to-date data series for 186 countries in Global Energy & CO2 data
View the detailed consumption trends at country level (graphs, tables, analysis) in the Kazakhstan energy report