Hungary Key Figures
- Population:
- 9.58 million
- GDP growth rate:
- 0.51 %/year
- Energy independence:
- 47.2%
Data of the last year available: 2024
- Total consumption/GDP:*
- 61.6 (2015=100)
- CO2 Emissions:
- 3.85 tCO2/cap
- Rate of T&D power losses:
- 6.04%
* at purchasing power parity
View all macro and energy indicators in the Hungary energy report
Hungary Energy News
View all news, archive your new and create your own daily newsletters only on your topics/countries of interest with Key Energy Intelligence
Hungary Energy Research
- Hungary's Energy & Climate Policy Framework: Hungary aims for 90% carbon-neutral power by 2030 and climate neutrality by 2050, phasing out coal by 2029. The government controls the energy sector, with a focus on nuclear and solar. Renewables target 30% by 2030, and energy efficiency measures are in place. The country is reducing gas dependency and has introduced support schemes for energy-intensive industries.
- Hungary's Energy Companies: Hungary's energy sector is dominated by state-owned MVM in electricity and MOL in oil and gas. MVM leads in power generation and transmission, while E.ON expands in distribution. MOL dominates oil and gas, with significant upstream and downstream operations. Gas transmission and storage are managed by MOL and MVM, respectively. District heating is provided by major firms like BERt and Veolia.
- Hungary's Energy Supply & Demand: In 2024, Hungary's carbon-free electricity production reached 69%, with nuclear and solar contributing significantly. Total energy consumption decreased to 24 Mtoe, with oil, gas, and primary electricity being the main sources. Solar capacity led with 7.7 GW, while nuclear power's operational lifetime was extended. Electricity production increased by 7%, with solar's share rising to 24%. CO₂ emissions from electricity generation fell by 64% since 2010, and Hungary remains a net importer of electricity. Oil and gas production covered a portion of domestic needs, with imports diversifying. Coal consumption declined sharply, and GHG emissions decreased by 7% in 2023.
- Hungary's Energy Use & Price by Sector: Energy consumption in Hungary fell sharply between 2021-2023, stabilising in 2024. Oil and electricity use rose, while gas declined. Residential energy prices are significantly lower than EU averages, though industrial prices remain high. Electricity's share of total energy use is growing, projected to double by 2050.
- Hungary's Issues & Prospects: Hungary is expanding its energy infrastructure, including nuclear (Paks II), gas, and solar projects, while enhancing cross-border interconnections to diversify supply.
Benefit from up to 2 000 up-to-date data series for 186 countries in Global Energy & CO2 data
A data overview is available in the global energy statistics app
Hungary Total Energy Production & Consumption
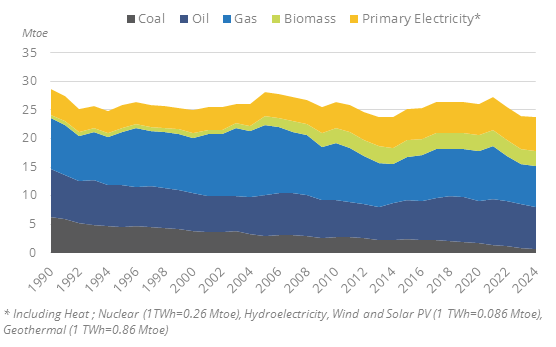
Energy consumption per capita is 2.5 toe (10% below the EU average and 21% below the EU27 average) (2024).
Total energy consumption has decreased rapidly since 2021, by 4%/year, reaching around 24 Mtoe in 2024. It remained broadly stable from 2018 to 2019 and rebounded by 4.6%in 2021, after a 1.5% reduction in 2020; it grew rapidly between 2014 and 2018 (+3%/year).
Graph: Primary Consumption Trends by Energy Source
Source: Hungary energy report
Interactive Chart Hungary Total Energy Production & Consumption
Source: Global Energy & CO2 data
Benefit from up to 2 000 up-to-date data series for 186 countries in Global Energy & CO2 data
View the detailed fondamentals of the market at country level (graphs, tables, analysis) in the Hungary energy report
Hungary Oil Production & Consumption
Oil production, which is distributed over 6 production sites, covers around 18% of the country's needs (1.3 Mt in 2024). In 2023, Russia was the main oil supplier (49%), followed by Slovakia (12%) and Austria (8%). In May 2025, MOL and MVM signed an agreement to raise oil imports from Azerbaijan.
The country has one refinery, the Szazhalombatta refinery of MOL, with a capacity of 162 kb/d (8.1 Mt/year), that processed 7.3 Mt in 2023. MOL closed its Zala refinery in 2001 (10 kb/d) and Tisza refinery (61 kb/d in 2008).
Source: Hungary energy report
Interactive Chart Hungary Crude Oil Production & Consumption
Source: Global Energy & CO2 data
Interactive Chart Hungary Refined Oil Products Production & Consumption
Source: Global Energy & CO2 data
Benefit from up to 2 000 up-to-date data series for 186 countries in Global Energy & CO2 data
Additionally, for more detailed information on refineries, you can request a sample of our EMEA Refineries Dataset
Hungary Natural Gas Production & Consumption
Gas production has been increasing by 5%/year since 2021, reaching 1.7 bcm in 2024 (+6%), after halving between 2006 and 2021 (-11% in 2021 alone to a record low of 1.5 bcm). This production represents around 20% of the country's gas needs.
Hungary is a net importer of gas and is involved in significant gas trade, with imports and exports growing. Its net imports have fluctuated in a range of 7-10 bcm since 2010. Net imports decreased by 33% in 2024 to 5.5 bcm, after a 25% increase in 2022 and a 11% decrease in 2023.
Source: Hungary energy report
Interactive Chart Hungary Gas Production & Consumption
Source: Global Energy & CO2 data
Benefit from up to 2 000 up-to-date data series for 186 countries in Global Energy & CO2 data
Additionally, for more detailed information on the LNG trade, you can request a sample of our EMEA LNG Trade Dataset
Hungary Coal and Lignite Production & Consumption
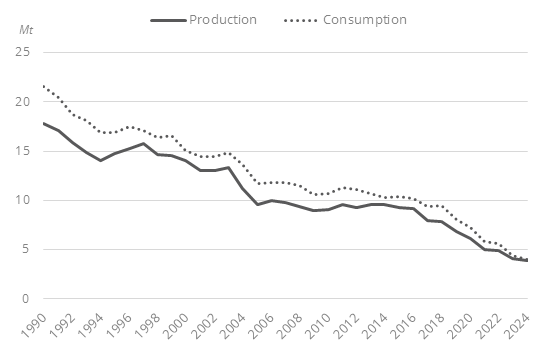
The country only produces lignite. Since 2010, lignite production has been decreasing on average by 6%/year, reaching 3.9 Mt in 2024 (-4.5% in 2024).
Coal imports decreased by 54% in 2024 to 0.2 Mt, after a 52% drop in 2023. They have been decreasing by 15%/year since 2010. Coal imports came from Czechia (27%), followed by the United States (21%), Poland (20%), and Ukraine (20%) in 2023.
Graph: Coal Production & Consumption
Source: Hungary energy report
Interactive Chart Hungary Coal and Lignite Production & Consumption
Source: Global Energy & CO2 data
Benefit from up to 2 000 up-to-date data series for 186 countries in Global Energy & CO2 data
View the detailed consumption trends at country level (graphs, tables, analysis) in the Hungary energy report
Hungary Renewable in % Electricity Production
The final updated NECP (2024) raised the target on renewables to a share of 30% of final energy consumption by 2030 (32% of which for electricity, 32% for heating and cooling, and 25% for transport). The NECP specifies that targets for electricity and the heating and cooling sectors are "indicative non-binding sub-targets". In 2023, this share reached 17.1% (19.5% of which for electricity, 22.3% for heating, and 7.6% for transport). In the NECP, the country set an objective of 12 GW of solar capacity and 1 GW of wind capacity in 2030.
Source: Hungary energy report
Interactive Chart Hungary Share of Renewables in Electricity Production (incl hydro)
Source: Global Energy & CO2 data
Benefit from up to 2 000 up-to-date data series for 186 countries in Global Energy & CO2 data
Learn more about renewables in the European Battery Market Analysis
Hungary GHG emissions and CO2 emissions
In 2020, the parliament adopted a law to achieve carbon neutrality by 2050. In the medium term, the country is committed to a binding GHG emissions reduction target of at least 50% by 2030 compared to 1990, as in other EU countries. The final updated NECP maintains the 50% target by 2030.
Source: Hungary energy report
Interactive Chart Hungary CO2 emissions
Source: Global Energy & CO2 data
Benefit from up to 2 000 up-to-date data series for 186 countries in Global Energy & CO2 data
View the detailed consumption trends at country level (graphs, tables, analysis) in the Hungary energy report