European Union Key Figures
- Population:
- 448 million
- GDP growth rate:
- 3.65 %/year
- Energy independence:
- 42.9 %
Data of the last year available: 2022
- Total consumption/GDP:*
- 66.7 (2005=100)
- CO2 Emissions:
- 5.90 tCO2/capita
- Rate of T&D power losses:
- 39.7 %
* at purchasing power parity
View all macro and energy indicators in the European Union energy report
European Union Energy News
View all news, archive your new and create your own daily newsletters only on your topics/countries of interest with Key Energy Intelligence
European Union Energy Research
- European Union's Energy & Climate Policy Framework: The EU has implemented various energy and climate policies, including the REPowerEU Plan, to enhance energy security and reduce reliance on Russian fossil fuels. Key measures include mandating 30% of REPowerEU spending on cross-border energy projects, introducing the Affordable Energy Action Plan to lower costs, and launching the Clean Industrial Deal to support clean manufacturing. The EU has also set ambitious targets for renewable energy, energy efficiency, and emissions reductions, with updated National Energy and Climate Plans (NECPs) and new regulations on electricity market design, gas storage, and carbon pricing. Sanctions on Russian oil and gas imports have been tightened, and efforts are underway to phase out these imports entirely. The EU aims to achieve climate neutrality by 2050, with interim targets for 2030 and 2035.
- European Union's Energy Supply & Demand: The EU's energy mix in 2024 saw 66% CO2-free sources, with renewables at 43%. Solar capacity surged, while coal declined. Energy consumption stabilised, with oil and gas remaining dominant. CO2 emissions fell 36% below 1990 levels.
- European Union's Energy Use & Price by Sector: In 2024, EU final energy consumption rose slightly (+0.7%) after prior declines, with oil, electricity, and gas remaining the dominant sources. Prices fell from 2022-2023 peaks but stayed above 2019 levels. Sectoral demand saw transport and industry rebound, while residential and services stabilised. Electricity's share is projected to grow significantly by 2050.
Benefit from up to 2 000 up-to-date data series for 186 countries in Global Energy & CO2 data
A data overview is available in the global energy statistics app
European Union Total Energy Production & Consumption
After two years of decline, primary energy consumption remained stable in 2024 (1 247 Mtoe). It decreased by 1.1%/year on average at normal climate since 2010 (-15%). Total energy consumption per capita is 2.8 toe (30% above the world average and 56% below the United States). In 2024, oil accounted for 34% of total energy consumption, gas for 22%, biomass for 12%, nuclear for 14%, coal for 9%, wind and hydro for 3% each, and solar for 2%.
Source: European Union energy report
Interactive Chart European Union Total Energy Production & Consumption
Source: Global Energy & CO2 data
Benefit from up to 2 000 up-to-date data series for 186 countries in Global Energy & CO2 data
View the detailed fondamentals of the market at country level (graphs, tables, analysis) in the European Union energy report
European Union Oil Production & Consumption
Crude oil and NGL production is limited and decreasing (19 Mt in 2024, i.e., less than 5% of its consumption); imports of crude oil represented over 90% of its consumption. In 2024, the United States accounted for 14% of total imports, followed by Norway (11%), Kazakhstan (10%), and the Netherlands (intra-EU trade, 9%). Russia only accounted for 3% of imports (down from 25% in 2021).
Source: European Union energy report
Interactive Chart European Union Crude Oil Production & Consumption
Source: Global Energy & CO2 data
Interactive Chart European Union Refined Oil Products Production & Consumption
Source: Global Energy & CO2 data
Benefit from up to 2 000 up-to-date data series for 186 countries in Global Energy & CO2 data
Additionally, for more detailed information on refineries, you can request a sample of our EMEA Refineries Dataset
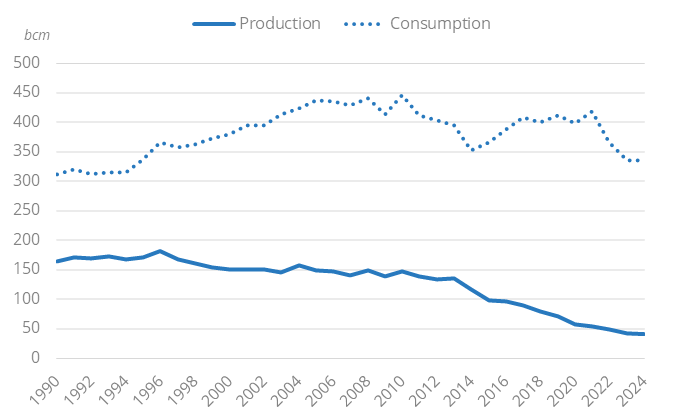
European Union Natural Gas Production & Consumption
Natural gas production has been divided by 3.6 since 2010 (-9%/year), falling by 15% in 2023 and by 3.6% in 2024 to 41 bcm, mostly due to the closure of the Groningen field in the Netherlands in October 2023.
Graph: Gas Production & Consumption
Source: European Union energy report
Interactive Chart European Union Gas Production & Consumption
Source: Global Energy & CO2 data
Benefit from up to 2 000 up-to-date data series for 186 countries in Global Energy & CO2 data
Additionally, for more detailed information on the LNG trade, you can request a sample of our EMEA LNG Trade Dataset
European Union Coal and Lignite Production & Consumption
In 2024, coal and lignite production fell for the second year in a row by 13% to 253 Mt (-20% in 2023); this decline was more rapid than between 2010 and 2019 (-3.5%/year, with a 20% fall in 2020). In 2021 and 2022, production temporarily rebounded (+7.5%/year), due to a higher demand from the power sector in a context of surging gas prices.
Source: European Union energy report
Interactive Chart European Union Coal and Lignite Production & Consumption
Source: Global Energy & CO2 data
Benefit from up to 2 000 up-to-date data series for 186 countries in Global Energy & CO2 data
View the detailed consumption trends at country level (graphs, tables, analysis) in the European Union energy report
European Union Renewable in % Electricity Production
The Renewable Energy Directive is the legal framework for the development of renewable energy in the EU economy. The 2020 target of 20% set in the Directive was exceeded, with a share reaching 22%.
Source: European Union energy report
Interactive Chart European Union Share of Renewables in Electricity Production (incl hydro)
Source: Global Energy & CO2 data
Benefit from up to 2 000 up-to-date data series for 186 countries in Global Energy & CO2 data
Learn more about renewables in the European Battery Market Analysis
European Union GHG emissions and CO2 emissions
The 2030 Climate Target Plan (2021) raised the EU target of GHG emissions reduction to at least 55% below 1990 levels by 2030. With the revision of the LULUCF regulation, this target was strengthened to 57% in 2023. According to the Commission's May 2025 assessment of NECPs, the EU is well on track to achieve the 55% emission cut target.
Source: European Union energy report
Interactive Chart European Union CO2 emissions
Source: Global Energy & CO2 data
Benefit from up to 2 000 up-to-date data series for 186 countries in Global Energy & CO2 data
View the detailed consumption trends at country level (graphs, tables, analysis) in the European Union energy report