
- Update
- Format
- 2 files (PDF report, Excel file)
- Pages
-
60 (Report only)
- Delivery
- Immediate by e-mail
- GENERAL OVERVIEW
- ENERGY AND CLIMATE POLICY FRAMEWORK
- ENERGY SUPPLY AND DEMAND
- ENERGY USE AND PRICE BY SECTOR
- STATISTICS
- ABBREVIATIONS
- GLOSSARY
Buy European Union energy report
Price without VAT. Depending on your status and location, VAT might be applicable. Get in touch with us for more information.
After validation, you will immediately receive 2 files by email (one pdf report and one excel file containing the datasets).
Overview
The EU has implemented a comprehensive energy and climate policy framework, accelerating the transition to renewables, enhancing energy efficiency, and phasing out Russian fossil fuel dependencies. Key measures include the REPowerEU Plan, stricter emissions targets, reformed electricity markets, and investments in hydrogen, nuclear, and clean industrial technologies to achieve climate neutrality by 2050.
Get more details on the table of contents and data files, as well as the list of graphs and tables by browsing the tabs below.
Highlights
- In 2030, the share of renewables in final energy consumption should reach 42.5-45% and GHG emissions in the ETS sectors should be cut by 62%.
- The target of all new passenger cars and light commercial vehicles at zero-emission by 2035 is likely to be reduced.
- The EU installed 103 GW of solar capacity in 2023 and 2024.
- CO2-free sources covered 66% of the power mix in 2024 (+18.5 pp since 2010), 43% of which are renewables (+24 pp).
- Energy-related CO2 emissions have been cut by 36% below their 1990 level.
- Final energy consumption increased slightly in 2024 (+0.7%), after two years of decline.
- Energy prices have decreased significantly from the record high in 2022-2023 but remain much higher than in 2019.
Energy & Climate Policy Framework
The Energy Directorate of the European Commission (DG ENER) supervises the energy sector and implements the energy policy of the EU. The Directorate-General for Climate Action of the Commission (DG CLIMA) leads the EU efforts to fight climate change.
Energy Supply & Demand
Gas:
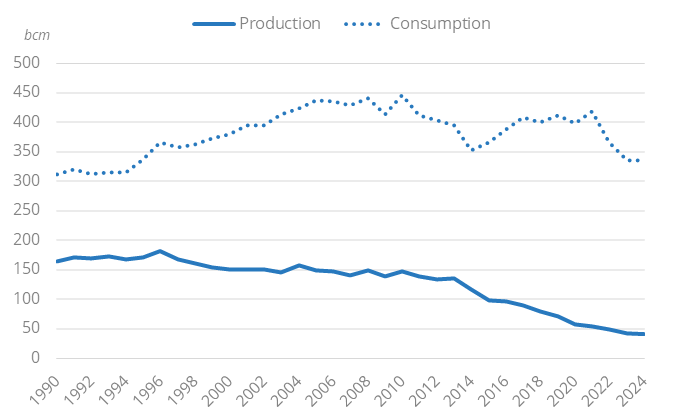
Natural gas production has been divided by 3.6 since 2010 (-9%/year), falling by 15% in 2023 and by 3.6% in 2024 to 41 bcm, mostly due to the closure of the Groningen field in the Netherlands in October 2023.
Graph: Gas Production & Consumption
Energy Use and Price by Sector
Energy Prices in Residential:
After rapid growth in 2022 and 2023, energy prices for households were broadly stablein 2024, although remaining significantly higher than in 2019 (+35% for electricity and +68% for gas).
- Graph 1: Final Intensity to GDP
- Graph 2: Primary Consumption Trends by Energy Source
- Graph 3: Total Consumption Market Share by Energy (2024)
- Graph 4: Installed Electric Capacity by Source
- Graph 5: Installed Electric Capacity by Source (2024)
- Graph 6: Gross Power Production by Source & Consumption
- Graph 7: Power Generation by Source (2024)
- Graph 8: CO2 Intensity of Electricity Generation
- Graph 9: Crude Oil Production & Consumption
- Graph 10: Petroleum Products Production & Consumption
- Graph 11: Gas Production & Consumption
- Graph 12: Coal Production & Consumption
- Graph 13: Emissions of GHG and CO2 from Fuel Combustion
- Graph 14: CO2-Emissions per Capita
- Graph 15: CO2 Intensity to GDP
- Graph 16: Final Demand Trends by Energy Source
- Graph 17: Final Consumption by Sector
- Graph 18: Final Consumption Market Share by Sector (2024)
- Graph 19: Share of Electricity in Total Final Energy Consumption
- Graph 20: Final Consumption in Industry by Energy Source
- Graph 21: Energy Prices Including Taxes in Industry
- Graph 22: Final Consumption in Transport by Energy Source
- Graph 23: Energy Prices Including Taxes in Transport
- Graph 24: Final Consumption in Residential, Services, Agriculture by Energy Source
- Graph 25: Energy Prices Including Taxes in Residential
- Economic Indicators: Annual historical data including population, GDP growth, imports and exports, inflation rate, energy security and efficiency indicators, CO2 emissions.
- Supply Indicators: Historical data including oil and gas reserves, electric and refining capacity, energy production, power production and external trade. All are detailed by energy source.
- Demand Indicators: Historical data including consumption per inhabitant, consumption trends, total consumption by energy source, final consumption by energy source and sector, and electricity consumption by sector.
- Energy Balances: Single table displaying the overall energy industry balance per annum, also graphically displayed by energy sub-segment.
The European Union energy market data since 1990 and up to
is included in the Excel file accompanying the European Union country report.
It showcases the historical evolution, allowing users to easily work with the data.
Key Data included in the excelsheet:
- Economic indicators: Annual historical economic indicators, energy security, energy efficiency and CO2 emissions.
- Supply indicators: Annual historical reserves, capacity, production and external trade (imports(+) exports(-) balance).
- Demand indicators: Annual historical consumption per capita, consumption trends, total consumption, final consumption (per energy and per sector) and electricity consumption total and per sector.
- Energy Balance: total and per energy.
- European Union Energy Prices: In addition to the analysis provided on the report we also provided a data set which includes historical details on the European Union energy prices for the follow items: price of premium gasoline (taxes incl.), price of diesel (taxes incl.), price of electricity in industry (taxes incl.), price of electricity for households (taxes incl.), price of natural gas in industry (taxes incl.), prices of natural gas for households (taxes incl.), spot price of Brent and CO2 emissions (from fuel combustion).