Ethiopia Key Figures
- Population:
- 132 million
- GDP growth rate:
- 7.32 %/year
- Energy independence:
- 92.7%
Data of the last year available: 2024
- Total consumption/GDP:*
- 66.3 (2015=100)
- CO2 Emissions:
- 0.10 tCO2/cap
- Rate of T&D power losses:
- 25.8%
* at purchasing power parity
View all macro and energy indicators in the Ethiopia energy report
Ethiopia Energy News
View all news, archive your new and create your own daily newsletters only on your topics/countries of interest with Key Energy Intelligence
Ethiopia Energy Research
- Ethiopia's Energy & Climate Policy Framework: Ethiopia aims to cut GHG emissions by 70% by 2035, with delayed electrification targets and a ban on fossil fuel vehicle imports. The country plans 25 GW of renewables by 2030, primarily hydro, and is reforming its power sector to enhance private participation. Energy efficiency measures and biofuel production are also being expanded to support climate goals.
- Ethiopia's Energy Companies: Ethiopia's electricity sector is state-run, with EEP handling generation and transmission, while EEU manages distribution. Hydroelectric power dominates, supplemented by wind and other renewables. The hydrocarbon sector is foreign-led, with recent shifts in exploration licenses and increased reliance on imports.
- Ethiopia's Energy Supply & Demand: Ethiopia's power capacity has tripled since 2010, reaching 6.1 GW in 2024, with hydropower dominating production (97%). Energy consumption grew at 3.2%/year (2010-2019), slowing to 1.9% post-2019, with biomass supplying 88% of total energy. Significant hydroelectric and geothermal resources remain underutilised. Electricity exports to Kenya and Tanzania began in 2022 and 2024, respectively.
- Ethiopia's Energy Use & Price by Sector: In 2024, final energy demand reached 41 Mtoe, with households and services accounting for 89% of consumption, primarily using biomass and waste. Transport demand has declined since 2021 due to electrification, while electricity prices remain among the lowest globally despite recent changes.
- Ethiopia's Issues & Prospects: Ethiopia aims to double hydropower capacity by 2030, with Grand Renaissance (5.15 GW) and Koysha (2.16 GW) under construction. Solar, wind, and geothermal projects are advancing, though delays persist. Transmission infrastructure is being upgraded to support growth.
Benefit from up to 2 000 up-to-date data series for 186 countries in Global Energy & CO2 data
A data overview is available in the global energy statistics app
Ethiopia Total Energy Production & Consumption
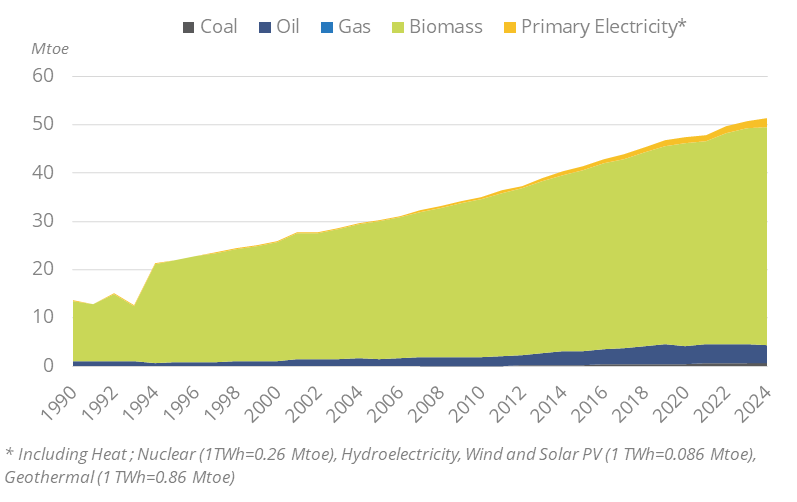
Total energy consumption is increasing steadily, albeit at a rate 3 times slower than economic growth: 3.2%/year on average over 2010-2019 versus 9.5%/year for the GDP, with aslow-down to 1.9%/year since 2019 in line with lower economic growth (close to 6%/year), reaching 51.5 Mtoe in 2024. Total energy consumption per capita is around 0.39 toe.
Graph: Primary Consumption Trends by Energy Source
Source: Ethiopia energy report
Interactive Chart Ethiopia Total Energy Production & Consumption
Source: Global Energy & CO2 data
Benefit from up to 2 000 up-to-date data series for 186 countries in Global Energy & CO2 data
View the detailed fondamentals of the market at country level (graphs, tables, analysis) in the Ethiopia energy report
Ethiopia Oil Production & Consumption
Since the closure of the Assab refinery in 1997, the country has imported all its oil requirements (about 4.9 Mt in 2024). The consumption of oil products increased significantly between 2010 and 2019, by almost 9%/year to 4.1 Mt. Since then, it has decreased by 2.5%/year to 3.6 Mt in 2024. In 2024, almost two thirds (63%) of oil products were used for transport, while industry accounted for 22% and residential, services, and agriculture for 12%.
Graph: Petroleum Products Production & Consumption
Source: Ethiopia energy report
Interactive Chart Ethiopia Crude Oil Production & Consumption
Source: Global Energy & CO2 data
Interactive Chart Ethiopia Refined Oil Products Production & Consumption
Source: Global Energy & CO2 data
Benefit from up to 2 000 up-to-date data series for 186 countries in Global Energy & CO2 data
Additionally, for more detailed information on refineries, you can request a sample of our EMEA Refineries Dataset
Ethiopia Coal and Lignite Production & Consumption
Coal production was almost non-existent in the country until 2020. Regional governments (notably Oromia) had already begun handing over coal mining sites to associations from around 2018, so production was underway but limited in scale and quality. In 2020 the federal government launched a policy drive to replace imported coal with locally mined coal, targeting the cement industry, which had relied almost 100% on imported coal up to 2019. This pushed coal production from 0.01 Mt in 2019 to 0.4 Mt in 2020.
Source: Ethiopia energy report
Interactive Chart Ethiopia Coal and Lignite Production & Consumption
Source: Global Energy & CO2 data
Benefit from up to 2 000 up-to-date data series for 186 countries in Global Energy & CO2 data
View the detailed consumption trends at country level (graphs, tables, analysis) in the Ethiopia energy report
Ethiopia Renewable in % Electricity Production
Ethiopia plans to develop 25 GW of renewables by 2030 under its 20-year Climate Resilient Green Economy Initiative (CRGE) strategy (2010-2030), comprising 22 GW of hydropower, 2 GW of wind, and 1 GW of geothermal (3.6 GW added between 2010 and 2022, of which 3 GW is hydro). The 2025 update of the NDC does not change those targets and remains in the continuity of the CRGE.
Source: Ethiopia energy report
Interactive Chart Ethiopia Share of Renewables in Electricity Production (incl hydro)
Source: Global Energy & CO2 data
Benefit from up to 2 000 up-to-date data series for 186 countries in Global Energy & CO2 data
Ethiopia GHG emissions and CO2 emissions
In its updated NDC 3.0 (September 2025), the country targets a 70.3% reduction in GhG by 2035 compared to BaU levels. This goal aims to cap total emissions at 125.8 MtCO2e, down from a projected 403.5 MtCO2e (-278 MtCO2eq). The commitment includes a 14% unconditional reduction funded domestically and a 54.8% conditional reduction dependent on international support. Major focus areas to achieve this include reforestation, climate-smart agriculture, and the transition to green transport.
Source: Ethiopia energy report
Interactive Chart Ethiopia CO2 emissions
Source: Global Energy & CO2 data
Benefit from up to 2 000 up-to-date data series for 186 countries in Global Energy & CO2 data
View the detailed consumption trends at country level (graphs, tables, analysis) in the Ethiopia energy report