Cyprus Key Figures
- Population:
- 1.36 million
- GDP growth rate:
- 3.45 %/year
- Energy independence:
- 10.1%
Data of the last year available: 2024
- Total consumption/GDP:*
- 74.5 (2015=100)
- CO2 Emissions:
- 4.58 tCO2/cap
- Rate of T&D power losses:
- 3.20%
* at purchasing power parity
View all macro and energy indicators in the Cyprus energy report
Cyprus Energy News
View all news, archive your new and create your own daily newsletters only on your topics/countries of interest with Key Energy Intelligence
Cyprus Energy Research
- Cyprus's Energy & Climate Policy Framework: Cyprus has set ambitious 2030 energy and climate targets in its final NECP, including 33% renewables and a 32% GHG reduction. The electricity market is fully liberalised, with 17 suppliers operating since 2025. Key measures include promoting renewables, energy efficiency, and green hydrogen, alongside EU-funded green transition initiatives.
- Cyprus's Energy Companies: Cyprus' EAC dominates electricity (63% capacity) and oil/gas sectors. No new exploration licences granted. Eni, ExxonMobil, and TotalEnergies operate key blocks.
- Cyprus's Energy Supply & Demand: Cyprus relies heavily on oil (85% of primary energy) but is expanding solar and wind capacity. Energy consumption rose 6% in 2024, with per capita use below EU average. Offshore gas discoveries may reduce import dependence.
- Cyprus's Energy Use & Price by Sector: In 2024, Cyprus' final energy demand rose 4% to 1.7 Mtoe, with transport (43%) and buildings (40%) as the largest consumers. Oil's share declined, while electricity and biomass grew. Industrial energy use stabilised, with oil's share halving since 2010. Electricity prices, influenced by oil, surged before falling in 2024. Transport and residential sectors saw fluctuating demand and prices.
- Cyprus's Issues & Prospects: Cyprus is developing its gas and renewable energy sectors, with plans for new CCGT and solar projects, while exploring offshore gas fields like Aphrodite and Cronos. Electricity demand is projected to grow, with significant investments in transmission infrastructure, including interconnections with Greece and Egypt. The country also aims to become a regional energy hub, with LNG import terminals and green hydrogen initiatives under development.
Benefit from up to 2 000 up-to-date data series for 186 countries in Global Energy & CO2 data
A data overview is available in the global energy statistics app
Cyprus Total Energy Production & Consumption
Primary energy consumption increased by 6% in 2024, reaching 2.4 Mtoe, after remaining stable in 2023. From 2013 to 2022, consumption increased by around 1.5%/year, after a sharp decline of approximately 8%/year from 2010 to 2013. At 1.7 toe, total energy consumption per capita is nearly 40% lower than the EU average.
Oil accounts for the largest share of primary energy consumption (85% in 2024), with biomass (6%) and primary electricity sources (5%) completing the energy mix.
Graph: Primary Consumption Trends by Energy Source
Source: Cyprus energy report
Interactive Chart Cyprus Total Energy Production & Consumption
Source: Global Energy & CO2 data
Benefit from up to 2 000 up-to-date data series for 186 countries in Global Energy & CO2 data
View the detailed fondamentals of the market at country level (graphs, tables, analysis) in the Cyprus energy report
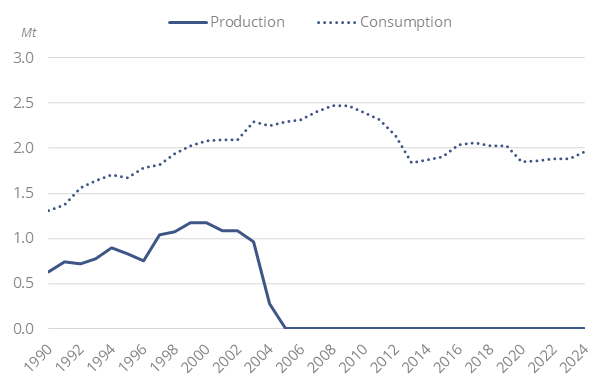
Cyprus Oil Production & Consumption
Since the closure of the Larnaca oil refinery in 2004 Cyprus has imported all its oil products. The refinery was transformed into an import terminal and a storage centre.
Since 2008, imports of oil products have declined by 1.4%/year, reaching 2.5 Mt in 2024. Greece accounts for 29% of these imports and Israel for 23% (2024).
Graph: Petroleum Products Production & Consumption
Source: Cyprus energy report
Interactive Chart Cyprus Crude Oil Production & Consumption
Source: Global Energy & CO2 data
Interactive Chart Cyprus Refined Oil Products Production & Consumption
Source: Global Energy & CO2 data
Benefit from up to 2 000 up-to-date data series for 186 countries in Global Energy & CO2 data
Additionally, for more detailed information on refineries, you can request a sample of our EMEA Refineries Dataset
Cyprus Natural Gas Production & Consumption
Cyprus does not produce or import natural gas.
Source: Cyprus energy report
Interactive Chart Cyprus Gas Production & Consumption
Source: Global Energy & CO2 data
Benefit from up to 2 000 up-to-date data series for 186 countries in Global Energy & CO2 data
Additionally, for more detailed information on the LNG trade, you can request a sample of our EMEA LNG Trade Dataset
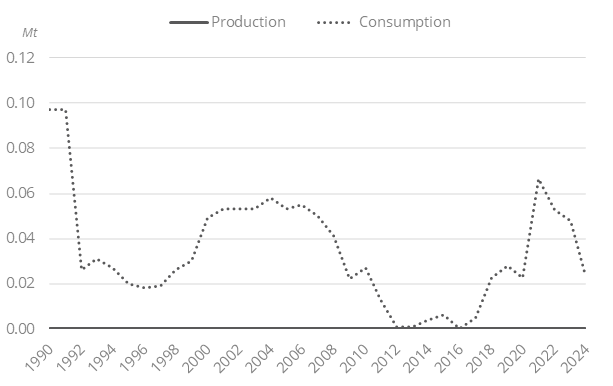
Cyprus Coal and Lignite Production & Consumption
Coal imports have almost disappeared (22 kt in 2024), declining by 30%/year since 202; they used to supply the cement industry.
Graph: Coal Production & Consumption
Source: Cyprus energy report
Interactive Chart Cyprus Coal and Lignite Production & Consumption
Source: Global Energy & CO2 data
Benefit from up to 2 000 up-to-date data series for 186 countries in Global Energy & CO2 data
View the detailed consumption trends at country level (graphs, tables, analysis) in the Cyprus energy report
Cyprus Renewable in % Electricity Production
The Cyprus Energy Agency, established in 2009, is in charge of the development of renewable energies.
The final NECP (2024) sets a target of 33% of renewables in final consumption by 2030.In 2024, this share reached 21.9% (24% for electricity, 41.6% for heating and cooling, and 7.2% for transport).
The 2020 target of a 13% share of renewables in final energy consumption was exceeded by almost 4 points (16.9%).
Source: Cyprus energy report
Interactive Chart Cyprus Share of Renewables in Electricity Production (incl hydro)
Source: Global Energy & CO2 data
Benefit from up to 2 000 up-to-date data series for 186 countries in Global Energy & CO2 data
Learn more about renewables in the European Battery Market Analysis
Cyprus GHG emissions and CO2 emissions
Cyprus' final NECP targets a 32% reduction in GHG emissions by 2030 compared to 2005; according to scenarios highlighted in the NECP, GHG emissions could decline by up to 26% by 2030. Additional measures are necessary to fill the gap.
Source: Cyprus energy report
Interactive Chart Cyprus CO2 emissions
Source: Global Energy & CO2 data
Benefit from up to 2 000 up-to-date data series for 186 countries in Global Energy & CO2 data
View the detailed consumption trends at country level (graphs, tables, analysis) in the Cyprus energy report