Bangladesh Key Figures
- Population:
- 174 million
- GDP growth rate:
- 4.22 %/year
- Energy independence:
- 61.4%
Data of the last year available: 2024
- Total consumption/GDP:*
- 67.7 (2015=100)
- CO2 Emissions:
- 0.55 tCO2/cap
- Rate of T&D power losses:
- 10.6%
* at purchasing power parity
View all macro and energy indicators in the Bangladesh energy report
Bangladesh Energy News
View all news, archive your new and create your own daily newsletters only on your topics/countries of interest with Key Energy Intelligence
Bangladesh Energy Research
- Bangladesh's Energy & Climate Policy Framework: Bangladesh aims for 4.1 GW of renewables by 2030, with 7% GHG reduction. The MPEMR oversees energy policy, while BERC regulates the sector. The Perspective Plan targets 57 GW grid capacity by 2041, diversifying fuel use and enhancing private investments. The 8th Five-Year Plan (2021-2025) focuses on expanding power capacity and improving investment conditions.
- Bangladesh's Energy Companies: Bangladesh's energy sector is dominated by state-owned entities like BPDB and Petrobangla, alongside private players. Chevron leads gas production, while BPDB oversees electricity generation, transmission, and distribution. Key players include Summit Power and foreign IPPs. Gas supply is primarily managed by Petrobangla subsidiaries, with Chevron contributing significantly. The sole coal mine, Barapukuria, faces production declines due to local protests.
- Bangladesh's Energy Supply & Demand: Bangladesh's energy demand is rising, with gas dominating supply but reserves insufficient. Electricity capacity has quadrupled since 2010, though reliance on fossil fuels persists, and GHG emissions are increasing.
- Bangladesh's Energy Use & Price by Sector: Energy consumption grows slower than GDP, with biomass and gas leading usage. Residential sectors dominate demand, while industrial and transport sectors show varied trends. Government controls energy prices, with recent fluctuations in electricity and fuel costs.
- Bangladesh's Issues & Prospects: Bangladesh aims to triple its power capacity by 2040, with ambitious renewable energy targets and significant gas, nuclear, and solar projects underway. However, delays and funding issues persist.
Benefit from up to 2 000 up-to-date data series for 186 countries in Global Energy & CO2 data
A data overview is available in the global energy statistics app
Bangladesh Total Energy Production & Consumption
The country's primary energy consumption, which was rising steadily (3%/year on average between 2010 and 2022), stabilised in 2023 and dipped by 2% in 2024 to 53 Mtoe. Energy consumption per capita stood at 0.31 toe in 2024 (28% above its 2010 level).
Natural gas accounted for 46% of consumption in 2024, while biomass accounted for 27%, oil for 15% and coal for 11%; the share of hydropower is marginal (2% in 2024). Since 2010, the share of gas has remained broadly stable (-2 pp), while the share of biomass has fallen by 13 pp, to the advantage of coal (+8 pp) and oil (+5 pp).
Source: Bangladesh energy report
Interactive Chart Bangladesh Total Energy Production & Consumption
Source: Global Energy & CO2 data
Benefit from up to 2 000 up-to-date data series for 186 countries in Global Energy & CO2 data
View the detailed fondamentals of the market at country level (graphs, tables, analysis) in the Bangladesh energy report
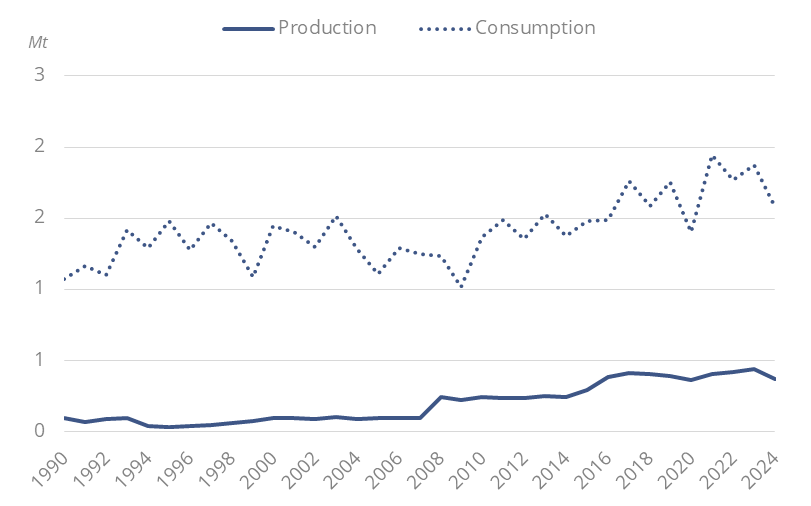
Bangladesh Oil Production & Consumption
Bangladesh's crude oil production is limited (below 0.5 Mt in 2024), covering less than ¼ of its domestic demand. The country imports 4 times its oil production (1.4 Mt of imports for a production of 0.4 Mt in 2024).
Graph: Crude Oil Production & Consumption
Source: Bangladesh energy report
Interactive Chart Bangladesh Crude Oil Production & Consumption
Source: Global Energy & CO2 data
Interactive Chart Bangladesh Refined Oil Products Production & Consumption
Source: Global Energy & CO2 data
Benefit from up to 2 000 up-to-date data series for 186 countries in Global Energy & CO2 data
Additionally, for more detailed information on refineries, you can request a sample of our Asia Refineries Dataset
Bangladesh Natural Gas Production & Consumption
Natural gas production has been declining slightly since a peak at 28 bcm in 2016 and reached 21 bcm in 2024 (-4%/year on average). It was increasing rapidly previously (+6%/year over 2010-2016). Overall, production covers nearly ¾ of domestic gas consumption.
Source: Bangladesh energy report
Interactive Chart Bangladesh Gas Production & Consumption
Source: Global Energy & CO2 data
Benefit from up to 2 000 up-to-date data series for 186 countries in Global Energy & CO2 data
Additionally, for more detailed information on the LNG trade, you can request a sample of our Asia LNG Trade Dataset
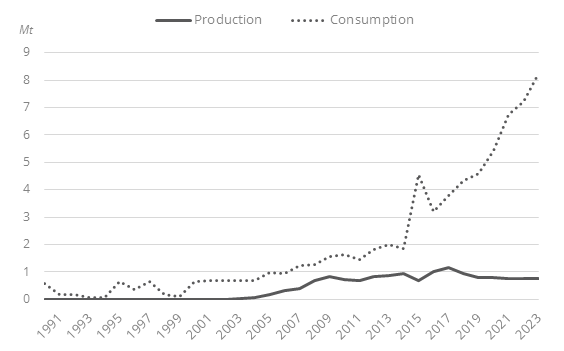
Bangladesh Coal and Lignite Production & Consumption
The country's first and only coal mine (Barapukuria) started production in 2005. Production has been declining since a peak at 1.2 Mt in 2017 to around 0.8 Mt in 2024. The country imports most of its coal needs to meet its demand, with 8 Mt of coal imported in 2024.
Graph: Coal Production & Consumption
Source: Bangladesh energy report
Interactive Chart Bangladesh Coal and Lignite Production & Consumption
Source: Global Energy & CO2 data
Benefit from up to 2 000 up-to-date data series for 186 countries in Global Energy & CO2 data
View the detailed consumption trends at country level (graphs, tables, analysis) in the Bangladesh energy report
Bangladesh Renewable in % Electricity Production
In 2023, the government set a target of covering 40% of its power generation with clean energy by 2041 (including 10% of renewables). The Ministry for Power, Energy, and Mineral Resources aims to reach an installed capacity of 40 GW by 2030 and 60 GW by 2041.
Under its new Renewable energy policy 2025, the country aims renewables to cover 20% of its electricity demand by 2030 and 30% by 2040.
Source: Bangladesh energy report
Interactive Chart Bangladesh Share of Renewables in Electricity Production (incl hydro)
Source: Global Energy & CO2 data
Benefit from up to 2 000 up-to-date data series for 186 countries in Global Energy & CO2 data
Bangladesh GHG emissions and CO2 emissions
In its NDC 3.0 (2025), Bangladesh set an unconditional greenhouse gas (GHG) emissions reduction target of 6.4% by 2035 compared with a BAU scenario, cutting GHG emissions by 26.7 MtCO2eq to 392 MtCO2eq in 2035. The conditional reduction target is 14%, representing a reduction of up to 58.2 MtCO2eq, to 360 MtCO2eq.
Source: Bangladesh energy report
Interactive Chart Bangladesh CO2 emissions
Source: Global Energy & CO2 data
Benefit from up to 2 000 up-to-date data series for 186 countries in Global Energy & CO2 data
View the detailed consumption trends at country level (graphs, tables, analysis) in the Bangladesh energy report