Argentina Key Figures
- Population:
- 45.7 million
- GDP growth rate:
- -1.7 %/year
- Energy independence:
- 100%
Data of the last year available: 2024
- Total consumption/GDP:*
- 98.3 (2015=100)
- CO2 Emissions:
- 3.37 tCO2/cap
- Rate of T&D power losses:
- 14.3%
* at purchasing power parity
View all macro and energy indicators in the Argentina energy report
Argentina Energy News
View all news, archive your new and create your own daily newsletters only on your topics/countries of interest with Key Energy Intelligence
Argentina Energy Research
- Argentina's Energy & Climate Policy Framework: Argentina aims to boost renewables to 20% of electricity by 2025 and achieve net-zero emissions by 2050. The government oversees energy policy, with deregulated sectors and recent plans to transition to cleaner energy sources. Regulatory bodies manage electricity, gas, and nuclear sectors, while biofuel policies and efficiency measures support climate goals.
- Argentina's Energy Companies: Argentina's energy sector is dominated by YPF in oil, gas, and electricity. Key players include Pampa Energia, Central Puerto, and AES in power generation. Privatisation has fragmented the market, with multiple firms operating in transmission and distribution. Gas and oil sectors are led by YPF, with significant foreign investment. Electricity prices remain low due to subsidies and tariff freezes.
- Argentina's Energy Supply & Demand: Argentina's energy mix is dominated by natural gas (49% in 2024), with significant hydro and wind contributions. Total energy consumption has declined 1% annually since 2021, reaching 78.5 Mtoe. The country holds substantial gas and oil reserves, though gas reserves are decreasing. Electricity generation relies heavily on gas (51%), with growing renewable contributions. CO2 emissions have decreased since 2021, and Argentina aims for a lower carbon intensity by 2050.
- Argentina's Energy Use & Price by Sector: In 2024, Argentina's final energy demand fell 2% to 52 Mtoe, with oil (41%) and gas (34%) dominating. Residential, services, and agriculture sectors led consumption (41%), followed by transport (33%) and industry (26%). Electricity's share remained stable at 20%, though projections aim for 35% by 2050. Oil product prices surged, while industrial electricity prices rose 80% in 2023.
- Argentina's Issues & Prospects: Argentina is expanding hydrocarbon production, particularly from the Vaca Muerta shale field, while advancing nuclear and renewable energy projects. The country aims to install 14 GW of new capacity by 2030, including significant investments in transmission infrastructure and energy efficiency. Key initiatives involve Chinese financing for nuclear plants, hydroelectric projects, and LNG export plans. Additionally, Argentina seeks to boost shale gas production and explore green hydrogen opportunities.
Benefit from up to 2 000 up-to-date data series for 186 countries in Global Energy & CO2 data
A data overview is available in the global energy statistics app
Argentina Total Energy Production & Consumption
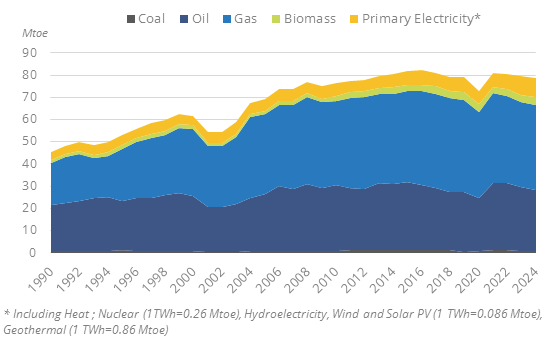
Total energy consumption has decreased by 1%/year since 2021, reaching 78.5 Mtoe in 2024, after an 11% rebound in 2021 and an 8% drop in 2020. It rose by 0.4%/year between 2010 and 2019.
Graph: Primary Consumption Trends by Energy Source (Mtoe)
Source: Argentina energy report
Interactive Chart Argentina Total Energy Production & Consumption
Source: Global Energy & CO2 data
Benefit from up to 2 000 up-to-date data series for 186 countries in Global Energy & CO2 data
View the detailed fondamentals of the market at country level (graphs, tables, analysis) in the Argentina energy report
Argentina Oil Production & Consumption
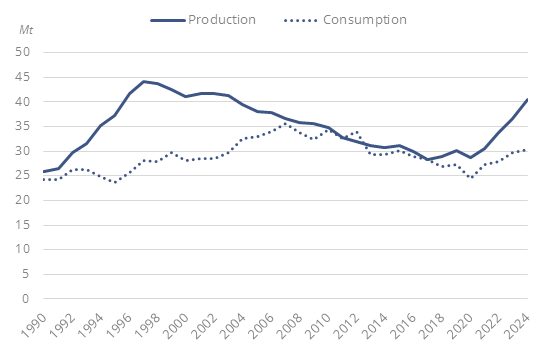
Oil production has jumped by 10%/year since 2021, reaching 40.5 Mt in 2024. Previously, it had been falling regularly from a peak level of 46 Mt in 1998 to 28 Mt in 2021. Argentina is the 4th largest oil producer in South America after Brazil, Venezuela, and Colombia.
Crude oil exports increased by 46% to 10 Mt in 2024 because consumption has increased more slowly than production since 2021.
Graph: Crude Oil Production & Consumption (Mt)
Source: Argentina energy report
Interactive Chart Argentina Crude Oil Production & Consumption
Source: Global Energy & CO2 data
Interactive Chart Argentina Refined Oil Products Production & Consumption
Source: Global Energy & CO2 data
Benefit from up to 2 000 up-to-date data series for 186 countries in Global Energy & CO2 data
Additionally, for more detailed information on refineries, you can request a sample of our America Refineries Dataset
Argentina Natural Gas Production & Consumption
Natural gas production was roughly stable between 2018 and 2023 and increased by 5% in 2024 to 46.5 bcm. Previously, it had increased by 3.2%/year over 2014-2018.
Gas exports soared from 0.2 bcm in 2019 to 2.4 bcm in 2024, except significative net imports in 2021 (11.3 bcm). Previously, the country stopped being a net exporter in 2008 and exports fell strongly between 2007 and 2020 because of rising domestic demand.
The country imported 2.2 bcm of LNG in 2023, mainly from Algeria (75%).
Source: Argentina energy report
Interactive Chart Argentina Gas Production & Consumption
Source: Global Energy & CO2 data
Benefit from up to 2 000 up-to-date data series for 186 countries in Global Energy & CO2 data
Additionally, for more detailed information on the LNG trade, you can request a sample of our America LNG Trade Dataset
Argentina Coal and Lignite Production & Consumption
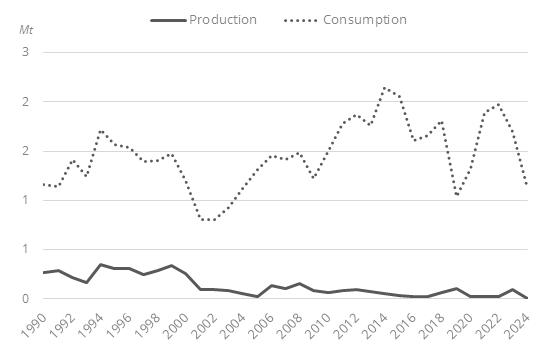
There was no coal production in 2024, and production has always been negligible. The country imported 1.1 Mt of coal in 2024, continuing the decreasing trend after the 2022 import peak. Coal imports have fluctuated between 1 Mt and 2 Mt since 2010.
Graph: Coal Production & Consumption (Mt)
Source: Argentina energy report
Interactive Chart Argentina Coal and Lignite Production & Consumption
Source: Global Energy & CO2 data
Benefit from up to 2 000 up-to-date data series for 186 countries in Global Energy & CO2 data
View the detailed consumption trends at country level (graphs, tables, analysis) in the Argentina energy report
Argentina Renewable in % Electricity Production
The Renewable Energy Act of 2015 sets the goal of increasing the share of renewables (apart from large hydro) to 20% of electricity production in 2025, with intermediate goals which were achieved (16% in 2021 and 18% in 2023). The law includes an obligation for large consumers (above 300 kW) to achieve these targets individually with fines on large electricity users that do not meet their target.
Source: Argentina energy report
Interactive Chart Argentina Share of Renewables in Electricity Production (incl hydro)
Source: Global Energy & CO2 data
Benefit from up to 2 000 up-to-date data series for 186 countries in Global Energy & CO2 data
Argentina GHG emissions and CO2 emissions
In its updated NDC (2021), the country announced its aim of not exceeding 349 MtCO2eq of net GHG emissions by 2030, which is equivalent to a 21% decrease in emissions compared to the historical peak reached in 2008. The Long-Term Strategy (LTS, 2022) and the National Energy Transition Plan to 2030 (2023) confirmed the 2050 net zero target.
Source: Argentina energy report
Interactive Chart Argentina CO2 emissions
Source: Global Energy & CO2 data
Benefit from up to 2 000 up-to-date data series for 186 countries in Global Energy & CO2 data
View the detailed consumption trends at country level (graphs, tables, analysis) in the Argentina energy report