
- Update
- Format
- 4 files (PDF report, 3 Excel files)
- Pages
-
66 (Report only)
- Delivery
- Immediate by e-mail
- GENERAL OVERVIEW
- ENERGY AND CLIMATE POLICY FRAMEWORK
- ENERGY COMPANIES
- ENERGY SUPPLY AND DEMAND
- ENERGY USE AND PRICE BY SECTOR
- ISSUES AND PROSPECTS
- STATISTICS
- ABBREVIATIONS
- GLOSSARY
Buy Argentina energy report
Price without VAT. Depending on your status and location, VAT might be applicable. Get in touch with us for more information.
After validation, you will immediately receive 4 files by email (one pdf report and 3 excel files containing the datasets).
Overview
Argentina is advancing its energy transition with a strategic focus on expanding renewable capacity, particularly wind and solar, while leveraging its substantial shale reserves in Vaca Muerta. The government’s policies aim to reduce emissions, enhance energy security, and attract investment through deregulation and infrastructure development.
Get more details on the table of contents and data files, as well as the list of graphs and tables by browsing the tabs below.
Highlights
- Argentina aims to increase the share of wind and solar to 20% of electricity production in 2025 and to reduce GHG emissions by 21% in 2030 compared to its 2008 emission peak.
- According to its Long-Term Strategy, the country aims to reach net zero emissions by 2050.
- Four companies represent one third of the installed power capacity.
- YPF (51% public) is the largest crude oil producer (48% in 2024).
- The share of natural gas in the power mix varies greatly with the level of hydropower (52% in 2024).
- The share of wind has increased by 10 points since 2017.
- The country holds South America's 3rd largest gas reserves.
- Oil products dominate the final energy mix (41% in 2024), followed by gas (34%).
- Gasoline and diesel prices soared in 2024. Household electricity prices are much lower than in Brazil or Chile.
- The Vaca Muerta shale oil and gas field is the main contributor to the hydrocarbon production expansion. Argentina is pushing China to finance its nuclear development, including the 1.2 GW Atucha III.
Energy & Climate Policy Framework
The Energy Secretariat ("Secretaria de Energía de la Naciόn"), under the Ministry of Economy, is in charge of developing the energy policy.
The deregulation and privatisation of the oil, gas and electricity sectors took place in the 90s in order to separate the production, transport, and distribution activities.
Energy Companies
Oil:
YPF, Yacimientos Petrolíferos Fiscales (51% public) is the national oil and gas company. YPF produced almost half of total crude oil production in 2024 (48%). In 2012, the Government seized control of the 51% stake owned by Repsol because of a lack of investment and decreasing hydrocarbon production by YPF.
Energy Supply & Demand
Resources:
Argentina is relatively well off in terms of energy resources. Gas and oil reserves amount to around 400 bcm and 340 Mt, respectively (end of 2024). The country ranks third in South America in terms of gas reserves, after Venezuela and Brazil, and fifth in terms of oil reserves. The country's natural gas reserves are decreasing because of the lack of investments by energy companies.
Energy Use and Price by Sector
Energy Prices in Residential:
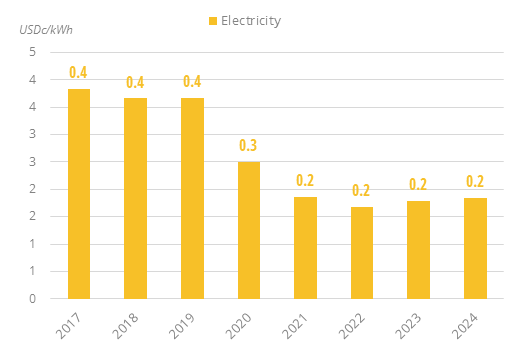
Electricity prices in the residential sector have increased by 5%/year since 2022, reaching US$1.85c/kWh in 2024. Prices had been on a downward trend since 2017.
Graph: Energy Prices in Residential (Taxes Included)
Issues & Prospects
Gas:
In 2023, YPF plans to invest US$5bn, including a great share for shale oil and gas production at Vaca Muerta (compared to US$4.1bn in 2022).
- Graph 1: Final Intensity to GDP
- Graph 2: Primary Consumption Trends by Energy Source (Mtoe)
- Graph 3: Total Consumption Market Share by Energy (2024, %)
- Graph 4: Installed Electric Capacity by Source (GW)
- Graph 5: Installed Electric Capacity by Source (2024, %)
- Graph 6: Gross Power Production by Source & Consumption (TWh)
- Graph 7: Power Generation by Source (2024, %)
- Graph 8: CO2 Intensity of Electricity Generation
- Graph 9: Crude Oil Production & Consumption (Mt)
- Graph 10: Petroleum Products Production & Consumption (Mt)
- Graph 11: Gas Production & Consumption (bcm)
- Graph 12: Coal Production & Consumption (Mt)
- Graph 13: GHG Emissions and CO2-energy Emissions (MtCO2)
- Graph 14: CO2-Emissions per Capita
- Graph 15: CO2 Intensity to GDP
- Graph 16: Final Demand Trends by Energy Source (Mtoe)
- Graph 17: Final Consumption by Sector (Mtoe)
- Graph 18: Final Consumption Market Share by Sector (2024, %)
- Graph 19: Share of Electricity in Total Final Energy Consumption
- Graph 20: Final Consumption in Industry by Energy Source (Mtoe)
- Graph 21: Energy Prices Including Taxes in Industry (USDc/kWh GCV)
- Graph 22: Final Consumption in Transport by Energy Source (Mtoe)
- Graph 23: Energy Prices Including Taxes in Transport (USD/l)
- Graph 24: Final Consumption in Residential, Services, Agriculture by Energy Source (Mtoe)
- Graph 25: Electricity Prices Including Taxes in Residential (USDc/kWh)
- Graph 26: Upcoming New Capacity by Energy Source (GW)
- Economic Indicators: Annual historical data including population, GDP growth, imports and exports, inflation rate, energy security and efficiency indicators, CO2 emissions.
- Supply Indicators: Historical data including oil and gas reserves, electric and refining capacity, energy production, power production and external trade. All are detailed by energy source.
- Demand Indicators: Historical data including consumption per inhabitant, consumption trends, total consumption by energy source, final consumption by energy source and sector, and electricity consumption by sector.
- Energy Balances: Single table displaying the overall energy industry balance per annum, also graphically displayed by energy sub-segment.
The Argentina energy market data since 1990 and up to
is included in the Excel file accompanying the Argentina country report.
It showcases the historical evolution, allowing users to easily work with the data.
Key Data included in the excelsheet:
- Economic indicators: Annual historical economic indicators, energy security, energy efficiency and CO2 emissions.
- Supply indicators: Annual historical reserves, capacity, production and external trade (imports(+) exports(-) balance).
- Demand indicators: Annual historical consumption per capita, consumption trends, total consumption, final consumption (per energy and per sector) and electricity consumption total and per sector.
- Energy Balance: total and per energy.
- Argentina Energy Prices: In addition to the analysis provided on the report we also provided a data set which includes historical details on the Argentina energy prices for the follow items: price of premium gasoline (taxes incl.), price of diesel (taxes incl.), price of electricity in industry (taxes incl.), price of electricity for households (taxes incl.), price of natural gas in industry (taxes incl.), prices of natural gas for households (taxes incl.), spot price of Brent and CO2 emissions (from fuel combustion).
The Argentina country dashboards are complemented with country forecasts from EnerFuture (excel file) with scenario comparison.
Data included in the excelsheet:
- Demand: Primary energy consumption, final energy consumption, by fuel, by sector.
- Power: Electricity generation & capacities, by technology.
- CO2: Total CO2 emissions.
- Macro-economy: Main macro-economic assumptions.
- Key indicators: Energy intensity, share of renewables, CO2 emissions per capita and per unit of GDP.