Algeria Key Figures
- Population:
- 45.6 million
- GDP growth rate:
- 4.10 %/year
- Energy independence:
- 100%
Data of the last year available: 2023
- Total consumption/GDP:*
- 147 (2005=100)
- CO2 Emissions:
- 3.35 tCO2/capita
- Rate of T&D power losses:
- 11.4%
* at purchasing power parity
View all macro and energy indicators in the Algeria energy report
Algeria Energy News
View all news, archive your new and create your own daily newsletters only on your topics/countries of interest with Key Energy Intelligence
Algeria Energy Research
Benefit from up to 2 000 up-to-date data series for 186 countries in Global Energy & CO2 data
A data overview is available in the global energy statistics app
Algeria Total Energy Production & Consumption
Compared to other developing countries with a similar development level, Algeria's consumption is high (1.5 toe per capita), partly because of consumption and losses in the energy sector (oil & gas production and LNG plants, mainly). Electricity consumption per capita reaches 1 584 kWh (2023).
Total energy consumption has increased rapidly since 2020 (7%/year), reaching 70 Mtoe in 2023. It grew steadily by 5%/year on average over 2010-2019.
Graph: CONSUMPTION TRENDS BY ENERGY SOURCE (Mtoe)
Source: Algeria energy report
Interactive Chart Algeria Total Energy Production & Consumption
Source: Global Energy & CO2 data
Benefit from up to 2 000 up-to-date data series for 186 countries in Global Energy & CO2 data
View the detailed fondamentals of the market at country level (graphs, tables, analysis) in the Algeria energy report
Algeria Oil Production & Consumption
Oil production (crude oil and NGL) decreased by 3% in 2023 to 60.9 Mt, after a 7% progression in 2022. In 2021, there was slight growth of 1%, after a significant decrease of 11% in 2020. Oil production was stable over 2012-2019 at around 67 Mt, following a period of decline since 2007 from 88 Mt.
Around 1/3 of the crude oil production is exported (22 Mt in 2023); that figure has been decreasing over time (-2%/year on average since 2012).
Source: Algeria energy report
Interactive Chart Algeria Crude Oil Production & Consumption
Source: Global Energy & CO2 data
Interactive Chart Algeria Refined Oil Products Production & Consumption
Source: Global Energy & CO2 data
Benefit from up to 2 000 up-to-date data series for 186 countries in Global Energy & CO2 data
Additionally, for more detailed information on refineries, you can request a sample of our EMEA Refineries Dataset
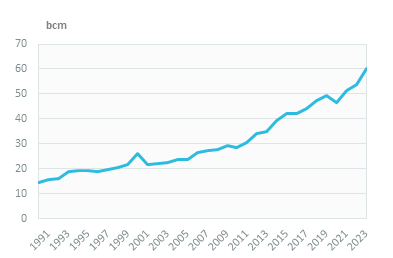
Algeria Natural Gas Production & Consumption
Gas consumption increased by 12%/year between 2020 and 2023 to 60 bcm, after a progression of 5% in 2022. Previously, it had been increasing by more than 6%/year over 2010-2019.
Power plants consume 42% of the gas, followed by buildings (residential and services, 24%) and industry (19%) (2023). The remaining 14% is used by the hydrocarbon sector.
Graph: NATURAL GAS CONSUMPTION (bcm)
Graph: GAS CONSUMPTION BREAKDOWN BY SECTOR (2023, %)
Source: Algeria energy report
Interactive Chart Algeria Gas Production & Consumption
Source: Global Energy & CO2 data
Benefit from up to 2 000 up-to-date data series for 186 countries in Global Energy & CO2 data
Additionally, for more detailed information on the LNG trade, you can request a sample of our EMEA LNG Trade Dataset
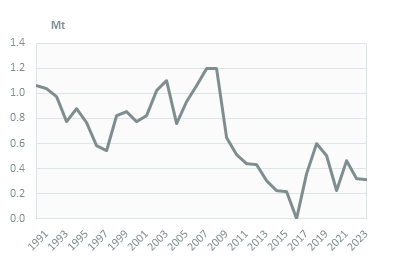
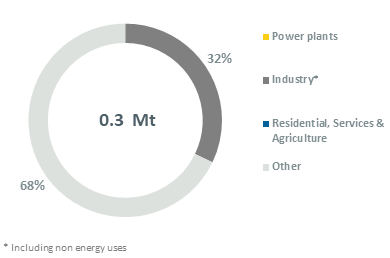
Algeria Coal and Lignite Production & Consumption
Coal consumption is low (0.32 Mt in 2023).
Graph: COAL CONSUMPTION (Mt)
Graph: COAL CONSUMPTION BREAKDOWN BY SECTOR (2023, %)
Source: Algeria energy report
Interactive Chart Algeria Coal and Lignite Production & Consumption
Source: Global Energy & CO2 data
Benefit from up to 2 000 up-to-date data series for 186 countries in Global Energy & CO2 data
View the detailed consumption trends at country level (graphs, tables, analysis) in the Algeria energy report
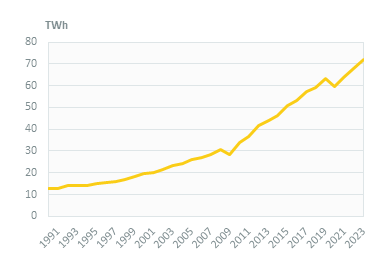
Algeria Power Production & Consumption
Electricity consumption has been increasing very rapidly since 2010 (1.69%/year), reaching 72 TWh in 2023. The electrification rate is close to 100%.
Graph: ELECTRICITY CONSUMPTION (TWh)
The residential sector accounts for 38% of electricity consumption, followed by industry with 33% and services with 20% (2023).
Graph: ELECTRICITY CONSUMPTION BREAKDOWN BY SECTOR (2023, %)
Source: Algeria energy report
Interactive Chart Algeria Power Production & Consumption
Source: Global Energy & CO2 data
Benefit from up to 2 000 up-to-date data series for 186 countries in Global Energy & CO2 data
View the detailed consumption trends at country level (graphs, tables, analysis) in the Algeria energy report
Algeria Renewable in % Electricity Production
The Renewable Energies and Energy Efficiency Commission (CEREFE), created in 2019, contributes to the national development of renewables and energy efficiency as an adviser and evaluates the national policy.
The Programme for the Development of Renewable Energy (2022) targets 22 GW of renewables by 2030, divided between 62% of solar PV and 23% of wind. This target means that 37% of the total installed capacity and 27% of the power mix will be from renewable sources. As only 0.6 GW have been installed at the end of 2023, this objective seems difficult to reach.
Source: Algeria energy report
Interactive Chart Algeria Share of Renewables in Electricity Production (incl hydro)
Source: Global Energy & CO2 data
Benefit from up to 2 000 up-to-date data series for 186 countries in Global Energy & CO2 data
Algeria GHG emissions and CO2 emissions
In its NDC, the country announced its aim to reduce GHG emissions by 7% by 2030 compared to a BAU scenario, which could be raised to 22% under the condition of access to new financial resources from bilateral and multilateral partners, as well as clean technology transfer on concessional and preferential terms.
CO2 emissions from energy use are growing rapidly, by around 4%/year since 2010, reaching 153 Mt in 2023. Algeria is the third largest emitter of CO2 in Africa.
Graph: CO2-ENERGY EMISSIONS (MtCO2)
Source: Algeria energy report
Interactive Chart Algeria CO2 emissions
Source: Global Energy & CO2 data
Benefit from up to 2 000 up-to-date data series for 186 countries in Global Energy & CO2 data
View the detailed consumption trends at country level (graphs, tables, analysis) in the Algeria energy report