
- Update
- Format
- 3 files (PDF report, 2 Excel files)
- Pages
-
49 (Report only)
- Delivery
- Immediate by e-mail
- GENERAL OVERVIEW
- ENERGY AND CLIMATE POLICY FRAMEWORK
- ENERGY COMPANIES
- ENERGY SUPPLY AND DEMAND
- ENERGY USE AND PRICE BY SECTOR
- ISSUES AND PROSPECTS
- STATISTICS
- ABBREVIATIONS
- GLOSSARY
Buy Trinidad and Tobago energy report
Price without VAT. Depending on your status and location, VAT might be applicable. Get in touch with us for more information.
After validation, you will immediately receive 3 files by email (one pdf report and 2 excel files containing the datasets).
Overview
Trinidad and Tobago’s energy sector centres on natural gas, which dominates production, consumption, and LNG exports, though reserves are declining. The government prioritises boosting hydrocarbon output while exploring renewables and cross-border gas projects to sustain energy security and industrial growth.
Get more details on the table of contents and data files, as well as the list of graphs and tables by browsing the tabs below.
Highlights
- Competitive bid rounds for exploration and production are held regularly, both onshore and in shallow and deep water, to raise oil and gas production.
- BP is the largest natural gas producer, with around 40% of total production, but Perenco is acquiring gas fields from BP and Woodside. BP and Shell are the main operators in LNG liquefaction.
- The country is the largest LNG producer and exporter in Latin America. The power and energy mix relies heavily on gas. Gas production is decreasing (2%/year since 2010).
- Around ¾ of final consumption is absorbed by non-energy uses in the petrochemical industry.
- Motor fuel prices are much lower than in other Caribbean countries, and electricity prices are among the lowest in the world.
- Gas reserves are depleting quickly, and the country is aiming to develop exploration to strengthen its position among the top 10 LNG producers worldwide.
- Several new gas fields should be developed over the coming years, including the Manatee and Dragon fields near the border with Venezuela.
Energy & Climate Policy Framework
The Ministry of Energy and Energy Industries (MEEI) supervises the energy sector.
Since 1997, natural gas has played an important role in the economy, supplanting oil and reflecting the increasing interest in the development of the gas and petrochemical industry. The Government's current priority is to raise gas and oil production, to meet rising domestic consumption.
Energy Companies
Gas:
The main companies involved in gas exploration-production activities include BP Trinidad and Tobago (BPTT, 40% of total production over the first 8 months of 2025), Shell (20%), EOG (17%), Perenco (11%), and Woodside Energy (9%).
Energy Supply & Demand
Resources:
Trinidad has substantial gas reserves, estimated at 279 bcm at the end of 2024, which, however, only represent around 10 years of production (down from 37 years in 2000). Its oil reserves are more modest (33 Mt), i.e. 10 years of average production (12 years in 2000).
Energy Use and Price by Sector
Energy Prices in Residential:
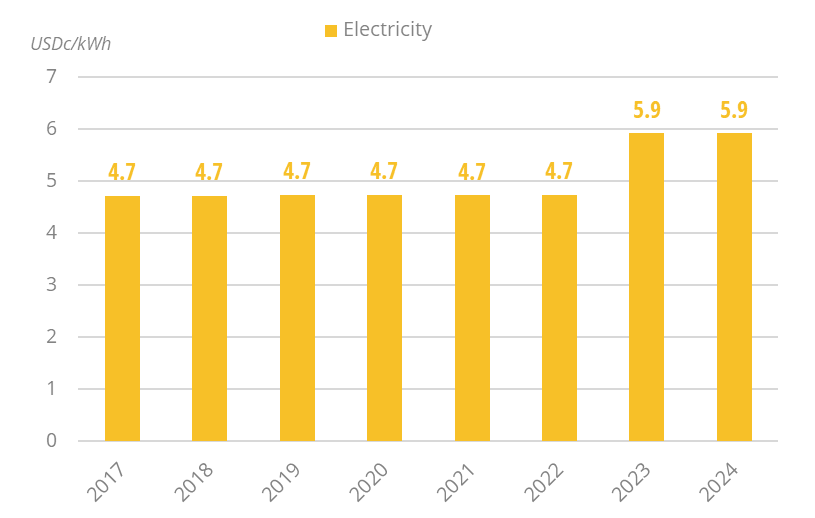
Electricity prices are regulated. In 2024, the price of electricity was stable at USD 5.9c/kWh for households (i.e. +25% compared to 2022). This is much lower than in Brazil or Colombia.
Graph: Energy Prices in Residential (Taxes Included)
Issues & Prospects
Gas:
Today, the gas reserves over production ratio seems insufficient to meet the rate of development and the growth in domestic consumption (10 years vs 37 years in 2000). A reduction in supply could lead to an increase in costs, which would undermine the competitiveness of downstream industries (ammonia and methanol).
- Graph 1: Primary Consumption Trends by Energy Source
- Graph 2: Total Consumption Market Share by Energy (2024)
- Graph 3: Installed Electric Capacity by Source
- Graph 4: Installed Electric Capacity by Source (2024)
- Graph 5: Gross Power Production by Source & Consumption
- Graph 6: Power Generation by Source (2024)
- Graph 7: Crude Oil Production & Consumption
- Graph 8: Petroleum Products Production & Consumption
- Graph 9: Gas Production & Consumption
- Graph 10: Emissions of GHG and CO2 from Fuel Combustion
- Graph 11: Final Demand Trends by Energy Source
- Graph 12: Final Consumption by Sector
- Graph 13: Final Consumption Market Share by Sector (2024)
- Graph 14: Final Consumption in Industry by Energy Source
- Graph 15: Energy Prices in Industry (Taxes Included)
- Graph 16: Final Consumption in Transport by Energy Source
- Graph 17: Energy Prices in Transport (Taxes Included)
- Graph 18: Final Consumption in Residential, Services, Agriculture by Energy Source
- Graph 19: Energy Prices in Residential (Taxes Included)
- Economic Indicators: Annual historical data including population, GDP growth, imports and exports, inflation rate, energy security and efficiency indicators, CO2 emissions.
- Supply Indicators: Historical data including oil and gas reserves, electric and refining capacity, energy production, power production and external trade. All are detailed by energy source.
- Demand Indicators: Historical data including consumption per inhabitant, consumption trends, total consumption by energy source, final consumption by energy source and sector, and electricity consumption by sector.
- Energy Balances: Single table displaying the overall energy industry balance per annum, also graphically displayed by energy sub-segment.
The Trinidad and Tobago energy market data since 1990 and up to
is included in the Excel file accompanying the Trinidad and Tobago country report.
It showcases the historical evolution, allowing users to easily work with the data.
Key Data included in the excelsheet:
- Economic indicators: Annual historical economic indicators, energy security, energy efficiency and CO2 emissions.
- Supply indicators: Annual historical reserves, capacity, production and external trade (imports(+) exports(-) balance).
- Demand indicators: Annual historical consumption per capita, consumption trends, total consumption, final consumption (per energy and per sector) and electricity consumption total and per sector.
- Energy Balance: total and per energy.
- Trinidad and Tobago Energy Prices: In addition to the analysis provided on the report we also provided a data set which includes historical details on the Trinidad and Tobago energy prices for the follow items: price of premium gasoline (taxes incl.), price of diesel (taxes incl.), price of electricity in industry (taxes incl.), price of electricity for households (taxes incl.), price of natural gas in industry (taxes incl.), prices of natural gas for households (taxes incl.), spot price of Brent and CO2 emissions (from fuel combustion).