
- Format
- 3 files (PDF report, 2 Excel files)
- Pages
-
54 (Report only)
- Delivery
- Immediate by e-mail
- GENERAL OVERVIEW
- ENERGY AND CLIMATE POLICY FRAMEWORK
- ENERGY COMPANIES
- ENERGY SUPPLY AND DEMAND
- ENERGY USE AND PRICE BY SECTOR
- ISSUES AND PROSPECTS
- STATISTICS
- ABBREVIATIONS
- GLOSSARY
Buy Ecuador energy report
Price without VAT. Depending on your status and location, VAT might be applicable. Get in touch with us for more information.
After validation, you will immediately receive 3 files by email (one pdf report and 2 excel files containing the datasets).
Overview
Ecuador’s energy strategy centres on expanding renewable capacity to achieve a 91% share in its power mix by 2032, while balancing oil production and refining to enhance energy security. Governed by the Ministry of Energy and Mines, the policy prioritises sustainability, efficiency, and private investment through regulated markets and competitive tenders.
Get more details on the table of contents and data files, as well as the list of graphs and tables by browsing the tabs below.
Highlights
- The country targets a 91% share of renewables in the power capacity mix in 2032.
- CELEC is the main power producer, with 72% of the production in 2024, and the sole transmission system operator (through Transelectric).
- Petroecuador, a state-owned oil company, represents about 80% of the country's production (2023).
- Ecuador has the 3rd largest proven oil reserves in South America.
- Hydropower accounts for around 66% of the power mix, with fluctuations depending on hydraulic availability.
- Final energy consumption has been rising rapidly since 2021.
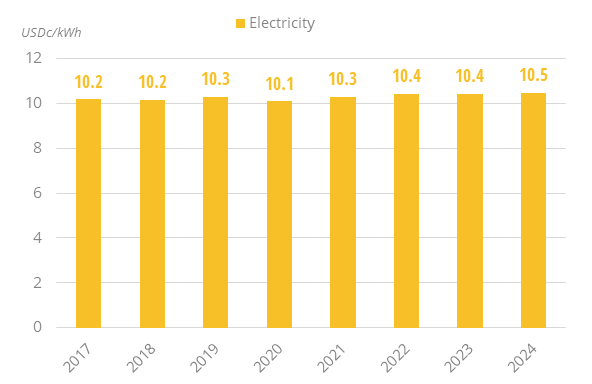
- Electricity prices for households have remained largely stable over the last decade.
- Electricity demand is expected to increase by around 4.5%/year by 2032. Around 90% of the additional capacity should be supplied with renewables.
Energy & Climate Policy Framework
The Ministry of Energy and Mines (MEM) oversees the country's energy policy. It was created following the 2018 merger of the Ministry of Electricity and Renewables, the Ministry of Hydrocarbons, and the Ministry of Mining.
Energy Companies
Gas:
The natural gas market is less developed than the oil sector. Natural gas is mostly used by the industry sector. Petroecuador took control of the Amistad gas field in 2010 after the refusal of the foreign company Noble Energy Inc. (NBL) to change its production-sharing contract to a new service agreement.
Energy Supply & Demand
Oil:
Oil production remained relatively stable between 2020 and 2024 (-0.2%/year) and stood below 25 Mt. Previously, it increased by 3%/year between 2009 and 2014, following the inauguration of the Panacocha field, and then decreased between 2014 and 2020(-2.2%/year).
Energy Use and Price by Sector
Energy Prices in Residential:
The price of electricity in residential has remained stable since 2017 and stood at 10.5 US$c/kWh in 2024.
Graph: Energy Prices in Residential (Taxes Included)
Issues & Prospects
Electricity:
In its Electricity Master Plan 2023-2032, Ecuador estimated that its electricity demand will increase by 4.1%/year (scenario Base) to 4.8%/year ("tendancial") by 2032. Around 90% of the required capacity increase should be supplied with renewable energy sources through 3 blocks totalling 1.8 GW.
- Graph 1: Primary Consumption Trends by Energy Source
- Graph 2: Total Consumption Market Share by Energy (2024)
- Graph 3: Installed Electric Capacity by Source
- Graph 4: Installed Electric Capacity by Source (2024)
- Graph 5: Gross Power Production by Source & Consumption
- Graph 6: Power Generation by Source (2024)
- Graph 7: Crude Oil Production & Consumption
- Graph 8: Petroleum Products Production & Consumption
- Graph 9: Gas Production & Consumption
- Graph 10: Emissions of GHG and CO2 from Fuel Combustion
- Graph 11: Final Demand Trends by Energy Source
- Graph 12: Final Consumption by Sector
- Graph 13: Final Consumption Market Share by Sector (2024)
- Graph 14: Final Consumption in Industry by Energy Source
- Graph 15: Energy Prices in Industry (Taxes Included)
- Graph 16: Final Consumption in Transport by Energy Source
- Graph 17: Energy Prices in Transport (Taxes Included)
- Graph 18: Final Consumption in Residential, Services, Agriculture by Energy Source
- Graph 19: Energy Prices in Residential (Taxes Included)
- Graph 20: Upcoming New Capacity by Energy Source
- Economic Indicators: Annual historical data including population, GDP growth, imports and exports, inflation rate, energy security and efficiency indicators, CO2 emissions.
- Supply Indicators: Historical data including oil and gas reserves, electric and refining capacity, energy production, power production and external trade. All are detailed by energy source.
- Demand Indicators: Historical data including consumption per inhabitant, consumption trends, total consumption by energy source, final consumption by energy source and sector, and electricity consumption by sector.
- Energy Balances: Single table displaying the overall energy industry balance per annum, also graphically displayed by energy sub-segment.
The Ecuador energy market data since 1990 and up to
is included in the Excel file accompanying the Ecuador country report.
It showcases the historical evolution, allowing users to easily work with the data.
Key Data included in the excelsheet:
- Economic indicators: Annual historical economic indicators, energy security, energy efficiency and CO2 emissions.
- Supply indicators: Annual historical reserves, capacity, production and external trade (imports(+) exports(-) balance).
- Demand indicators: Annual historical consumption per capita, consumption trends, total consumption, final consumption (per energy and per sector) and electricity consumption total and per sector.
- Energy Balance: total and per energy.
- Ecuador Energy Prices: In addition to the analysis provided on the report we also provided a data set which includes historical details on the Ecuador energy prices for the follow items: price of premium gasoline (taxes incl.), price of diesel (taxes incl.), price of electricity in industry (taxes incl.), price of electricity for households (taxes incl.), price of natural gas in industry (taxes incl.), prices of natural gas for households (taxes incl.), spot price of Brent and CO2 emissions (from fuel combustion).