BRICS and the USA draw the world's energy consumption
Based on its 2013 data for G20 countries, Enerdata analyses the trends of the world energy demand.
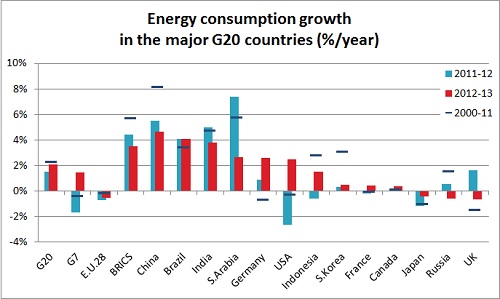
G20’s 2013 Key Figures
- + 2.8% economic growth (at purchasing power parity)
- + 2.1% (10.7 Gtoe) energy consumption growth
- + 2.0% (26.1 GtCO2) CO2 emissions increase
The USA returned to a dynamic growth level, while the BRICS kept driving energy demand.
The publication related to the world energy demand underlines main conclusions from the analysis of latest 2013 energy data:
- Coal met half of the 2013 rise in energy consumption
- In 2013, CO2 emissions have increased at the same rate as energy consumption
- The growth of oil demand in the BRICS halved in 2013
- Oil independence: the opposite paths of the USA and China
- The gas price rise in the USA resulted in a pronounced slowdown in consumption growth
- With more than 53 bcm of LNG contracts signed, the USA will become a new key player in gas exchange
- BRICS’ electricity demand growth was three times higher than total G20 countries
- For the first time in Europe, renewables dominate the electricity mix
- In 2013 a Chinese person emits almost as much CO2 as an European person