Enerdata’s analysis and key figures of global energy trends and climate impacts.

Each year, our analysts leverage our internationally recognized databases and expertise to produce Global Energy Trends – a comprehensive, independent study of the past year’s energy market trends and the resulting environmental impacts.
This publication analyses the G20 nations – a key to understanding energy and climate worldwide, as the G20 accounts for 80% of global energy demand – and highlights important 2018 evolutions in global markets.
Request Global Energy Trends 2019 Read the official press release Watch the recorded webinar
G20* Key Energy Figures in 2018
* G20 countries account for 80% of global energy consumption
** Energy-related CO2-emissions from energy combustion (>80% of CO2 emissions)
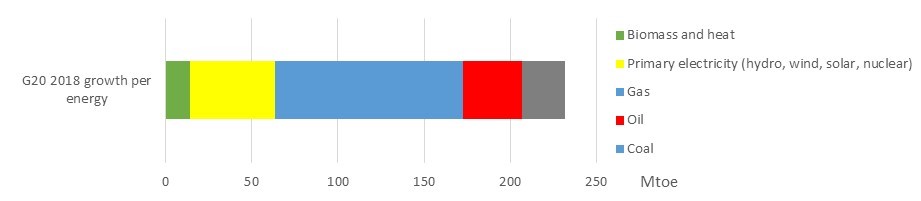
Steady economic growth, slow reduction in energy intensity and slow evolution of the G20’s energy mix made 2018 quite similar to 2017 in these respects. As the figures above show, this combination led to record-high energy demand (+2.1%) and energy-related CO2 emissions (+1.7%).
In the OECD, several cyclical factors contributed to these changes, such as a cold winter and hot summer in the USA, and good hydro availability combined with mild weather in the EU.
Outside of the OECD, demand growth was led by gas and electricity (+6%), but coal and oil also increased (+2-3%).
Other Notable 2018 Trends in the G20, as Detailed in the Global Energy Trends Publication:
- Spectacular increase of natural gas consumption (+4.8%), with China and the USA responsible for more than 70% of the global increase.
- Still no peak in oil and gas consumption (which grew at +1% and +0.7%, respectively)
- Increase in electricity consumption of 3.7% – a normal growth rate for electricity, which usually grows more quickly than other energies due to the electrification of uses.
- Strong development of renewables: +10% in wind power generation and +24% in solar power generation. However: no acceleration in capacity additions.
Get the full analysis Global Energy Trends, 2019 edition (FREE)