Why progress differs across countries, sectors and energy systems in the G20
Request this Executive Brief in PDF format (FREE)
Industrial electrification is increasingly seen as a key route to decarbonisation, competitiveness and energy security. But what does electrification really mean for industry, and why does progress differ so sharply across countries and industrial branches? This article explores the main levers that can accelerate the shift to electricity, from technology maturity and industrial structure to grid access, regulation and energy pricing. It also highlights the contrasting situation across branches: while some processes can already switch to electricity, others remain difficult to electrify because of technical requirements, especially for high-temperature heat. Finally, the analysis examines the role of electricity prices—and their competitiveness relative to gas—as well as the regulatory, economic and technical barriers that still slow down industrial electrification.
Scope
The scope of this note covers most G20 countries, excluding Russia, Mexico, Saudi Arabia and South Africa, countries for which no up-to-date data is available. Throughout the rest of this note, the term “G20” refers to this restricted group of countries.
The scope focuses on the industry sector (sometimes referred to as “industry”), with the clarification that data centres are excluded. They are classified under the tertiary sector.
Industrial electricity consumption keeps growing
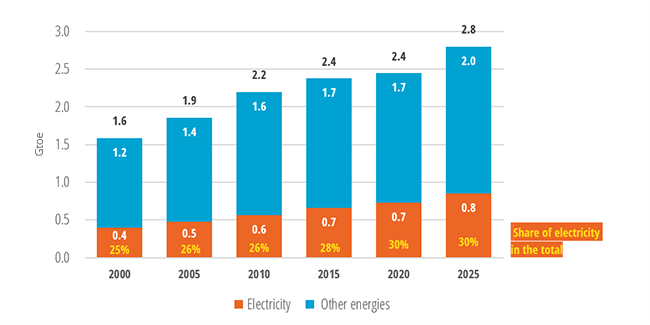
Industrial electricity consumption in G20 countries more than doubled between 2000 (0.4 Gtoe) and 2025 (0.8 Gtoe). Across all energy sources combined (coal, gas, petroleum products, electricity, etc.), the share of electricity in the energy mix rose by 5 percentage points, from 25% in 2000 to 30% in 2025. (Figure 1)
Figure 1: Final consumption of industry – G20
Source: Enerdata, Global Energy & CO2 Data
This “share of electricity in final consumption of industry” is the indicator of so-called apparent electrification (abbreviated as “electrification” below).
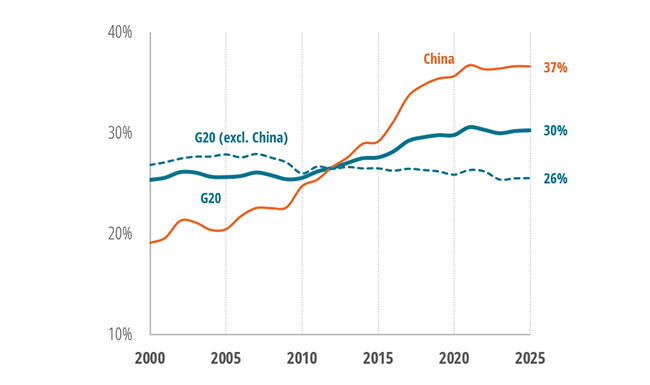
At country level, the increase in electricity consumption sometimes takes place as a “replacement” for other energy sources. This is the case, for example, in China, where coal—which covered more than half (60%) of industrial energy demand in 2000 and only 30% in 2025—was replaced by electricity and gas: the share of electricity rose from 19% to 37%, while the share of gas increased from 2.5% to 13%.
In the USA, the share of electricity in industry final consumption remained stable (30%). It was mainly the share of gas that increased as the share of coal declined.
When calculated using total final consumption, the electrification value is influenced by other energy sources, and its interpretation must take account of the consumption dynamics of those other sources—coal and gas in particular.
China is driving industrial electrification in the G20
Within the G20, the average apparent electrification of the industry sector increased by 5 percentage points between 2000 (25%) and 2025 (30%), with a stronger rise over the 2009–2021 period. This overall trend is highly contrasted when looking at developments in each country separately. A very different picture then emerges, with China on one side, where electrification nearly doubled (from 19% in 2000 to 37% in 2025), and the other countries on the other side, which on average and in a relatively homogeneous way broadly stagnated (-1 percentage point, from 27% in 2000 to 26% in 2025). (Figure 2)
Figure 2: Share of electricity in final consumption of industry (%) – Weight of China in the G20
Source: Enerdata, EnerDemand, Global Energy & CO2 Data
China’s industry, the largest in the G20, is rapidly electrifying
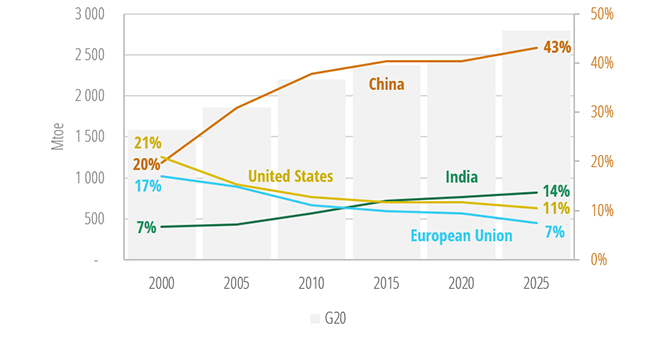
China’s share in G20 industry final consumption has increased considerably since 2000: while it stood at 20% in 2000, it rose sharply to reach 43% in 2025. This increase occurred alongside the rise in G20 final energy consumption (1,600 Mtoe in 2000, 2,800 Mtoe in 2025). Indeed, over this period, the country became the largest manufacturer and exporter in the world and contributed to most of the increase in final energy consumption and in electricity consumption of industry in the G20. Then, China’s electrification value mechanically pulls up the average electrification level of G20 countries. (Figure 3)
Figure 3: Final energy consumption of industry - Amount for G20 (Mtoe, left axis) and relative shares for a selection of regions (percentage, right axis)
Source: Enerdata, EnerDemand, Global Energy & CO2 Data
Other large economies show limited progress in electrification
India has also seen its share of consumption amongst G20 countries increase, doubling between 2000 and 2025 to 14% in 2025 but, unlike China, its electrification level has stagnated at around 15%. It therefore tends instead to pull the G20 average down.
The share of the USA in the G20 industry’s energy consumption has nearly halved since 2000, losing 10 percentage points (from 21% to 11%); with an electrification level stagnating at around 30%, the country has since 2019 moved slightly below the average electrification level of G20 countries.
The EU lost 10 percentage points (from 17% to 7%). Despite a modest increase in its electrification level (+4 percentage points, from 30% to 34%), this level remains relatively high and still pulls the average for G20 countries slightly upwards. Among the EU Member States, Poland recorded a strong increase in electrification, rising from 20% in 2000 to 34% in 2025.
What explains varying levels of electrification?
Some industrial sectors remain difficult to electrify
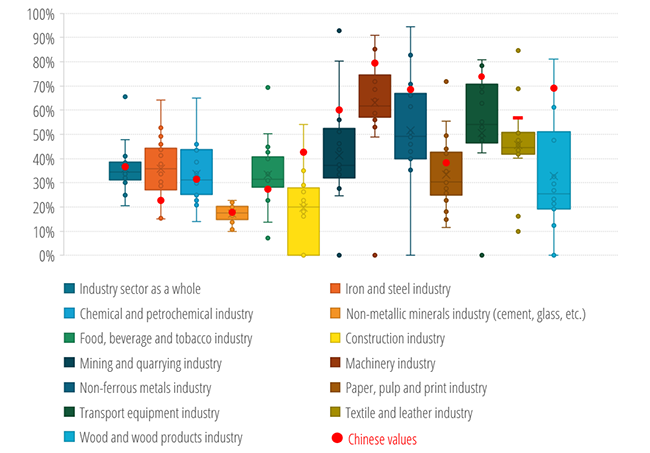
Differences in electrification levels between countries can be partly explained by differences in their industrial structure. In industry, despite the growing maturity of new technologies, some manufacturing processes remain difficult to electrify. This is the case for very high-temperature processes used, for example, in cement or glass manufacturing, which require high-temperature furnaces that are difficult to electrify. As a result, electrification levels vary across branches. Figure 4 highlights these differences, in particular the low level observed in the Non-metallic minerals industry branch (between 10% and 22%). A country that did not produce cement, glass and/or steel would therefore be very likely to reach a high level of electrification.
Figure 4: Shares of electricity final consumption by industrial branch in 2025
Source: Enerdata, EnerDemand
Figure 4 shows a higher level of electrification in China than in other G20 countries in most branches, with the exception of Iron and steel and Food, beverage and tobacco.
Do electricity prices drive industrial electrification?
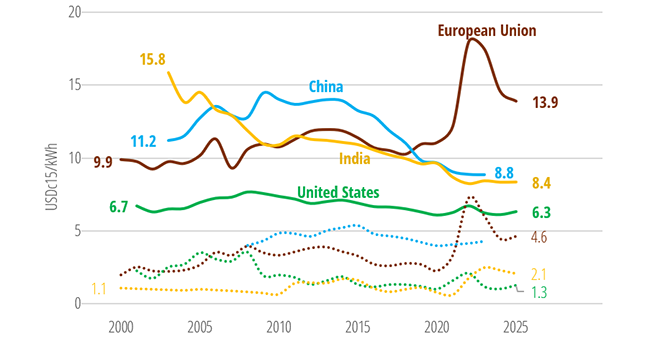
The electrification of industrial processes is also supported by an electricity price that is competitive compared with other energy sources. China, whose electrification increased steadily between 2015 and 2020, saw its electricity price fall sharply over the same period (from USD13c/kWh to USD9.5c/kWh).
Figure 5: Evolution of electricity (lines) and gas (dots) prices (constant, taxes included)
Source: Enerdata, EnerDemand
More recently, the EU saw its electricity price surge as a consequence of the energy crisis triggered by the war in Ukraine and its repercussions on natural gas supply (Figure 5).
Yet electrification did not decline in the EU over this period, perhaps because of a lack of competitive alternatives (gas prices rose at the same time), or because industrial players anticipated a future decrease, assuming that these prices were cyclical?
In any case, no correlation is observed between electricity (or gas) prices and an electrification trend. To understand and forecast its evolution, other factors therefore need to be considered: regulatory, political, economic and infrastructure-related factors.
Multiple barriers continue to slow electrification
Among the barriers to electrification, connection to the electricity grid combines regulatory and infrastructure-related challenges: it is regularly highlighted as a source of delays, administrative complexity, or technical bottlenecks, particularly when several activities (renewables, transport, data centres) compete for access.
Regulation is a lever for—or a barrier to—electrification. In general, the price per kWh of electricity remains structurally higher than that of gas. Behind this limited competitiveness are taxes, levies and network charges, which weaken the economic case for switching from gas or other fossil fuels to electric industrial heat, even when the necessary technologies are technically available.
Finally, the electrification of industry—as of other sectors of activity—is supported by environmental arguments promoting the decarbonisation of society, which several countries, in particular those in the European Union, translate into decarbonisation targets for the sector.
Ensuring that electricity prices are competitive with other energy sources, limiting regulatory and administrative constraints, and simplifying and accelerating grid connection procedures are all prerequisites for electrifying industry to a high level (above 35% on average, across all branches) compatible with ambitious decarbonisation targets. Seen in this light, electrification appears as a marker of modernity and competitiveness.
Raising ambitions: industry electrification, a key to stronger energy security and resilience in the EU?
In July 2026, the European Commission presented an Electrification Action Plan aimed at making Europe the world’s first electro-powered continent. The EU acknowledged that “while 70% of EU electricity is now generated from homegrown clean energy sources, the electrification rate of energy demand has stalled at 23% over the past decade” and highlighted the “need to accelerate the electrification of energy-using sectors, notably industry, transport and building”.
The proposed Electrification Action Plan sets an indicative electrification target of 46% by 2040 as part of the post-2030 Energy Union package, which could reduce the EU’s fossil fuel import bill by EUR260bn annually by 2040. To give an order of magnitude, this amount represents nearly 70% of the EU's 2024 energy import bill, or 1.3% of EU GDP of recent years. Reaching this target will require massive investments in the EU industry – which was strongly hit by surging energy prices in 2022-2023 – and an improved competitiveness of electricity prices (compared to gas).
However, while electrification enhances energy security by reducing dependence on imported fossil fuels, it simultaneously creates new dependencies on critical minerals (copper, lithium, nickel, cobalt, and rare earth elements) and the associated industrial supply chains, which are highly concentrated in China1. Electrification does create dependencies, but of a different nature and generally less immediate than those associated with fossil fuels: a disruption in oil supply has an immediate impact on energy use, whereas a disruption in lithium or rare earth supplies primarily affects the manufacturing of new equipment, without impairing the operation of equipment that has already been installed.
KEY TAKEAWAYS
- Industrial electricity consumption in G20 countries has doubled since 2000 but the rising electrification has been driven by China.
- Industrial electrification posted few progress in India, the USA and the EU, due to various factors such as difficulties to electrify some branches, rising electricity prices and other regulatory, economic and political hurdles.
- Accelerating the electrification of industry may improve the resilience of the sector to supply shocks and rising prices but requires political support, such as the EU Electrification Action Plan.
Note:
- For example, export restrictions imposed by China on certain rare earth elements in 2025 disrupted several industrial sectors and demonstrated how relatively small markets can become strategic bottlenecks for the broader economy.