See also
Energy efficiency trends in households in the EU
What has been the overall trend in households’ energy consumption in the EU since 2010?
What are the main drivers of the energy demand of households in the EU?
Why is energy efficiency households slowing down in Europe?
Get this executive brief in pdf format
At the EU level, buildings account for 43% of final consumption. Residential buildings account for two thirds of this consumption and are associated with a high untapped energy savings potential. They therefore represent a major challenge for achieving the EU's climate and environmental objectives. For this reason, the EU has developed a comprehensive regulatory framework based on energy efficiency measures targeting buildings (EPBD, EED, Renovation Wave Strategy).
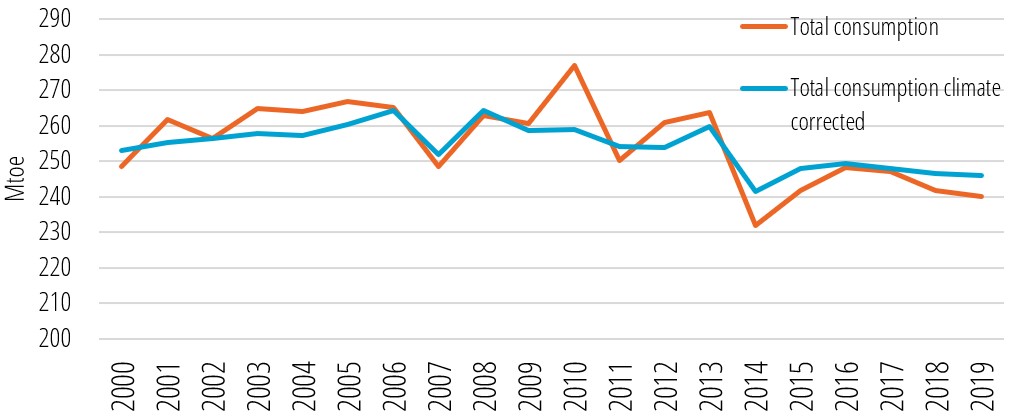
While the consumption of residential buildings has decreased overall over the period 2000-2019 (sometimes with large inter annual variations due to climatic variability, see Figure 1), this decrease cannot be entirely attributed to energy efficiency improvements. Other effects come into play, such as the evolution of the built surface, energy prices, occupant behaviours, occupancy rates, etc. Based on the methodology developed in the European Odyssee-Mure project, which allows to distinguish between several effects, we have highlighted a slowdown in energy efficiency progress in the residential sector at EU level since 2014. Let’s investigate the possible causes of this slowdown.
Trends of energy consumption of dwellings
Comparison of total energy consumption between EU countries
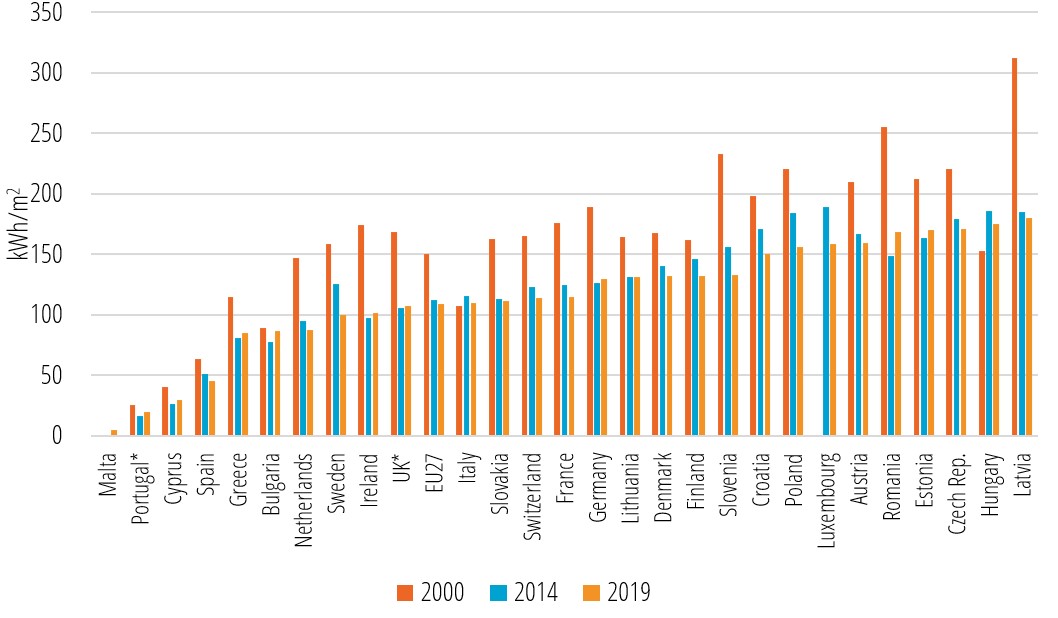
The average energy consumption in the EU is 1.3 toe/dwelling in 2019. There are large disparities between countries, even after adjustment to the same climate, ranging from 0.5 toe/dwelling in Malta to 2.3 toe/dwelling in Luxembourg. This unit consumption has been decreasing in most countries since 2000 (-1.0%/year at EU level) (Figure 2).
Figure 2: Energy consumption per dwelling, scaled to the EU average climate
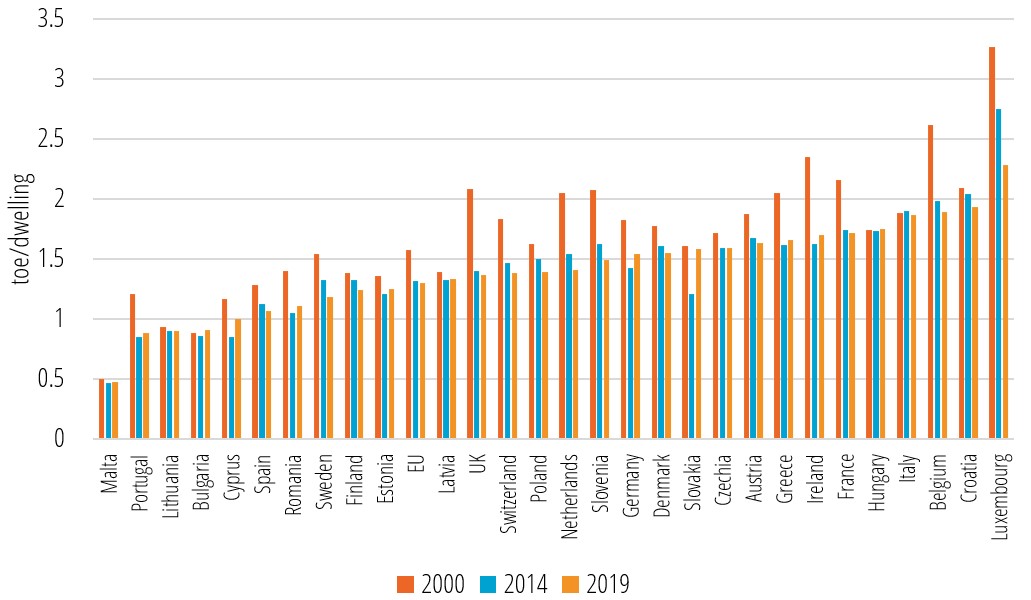
Source: Odyssee
For the period 2014-2019, the trends are more contrasted between countries, with mainly 3 types of evolution (Figure 2):
- 8 countries with a downward trend accelerating after 2014 (Spain, Italy, Poland, Luxembourg, Croatia, Sweden, Denmark, Finland).
- 11 countries with a downward trend slowing down or stabilising after 2014 (among which the Netherlands, UK, France, Austria).
- 11 countries with a decreasing trend reversing (i.e., with increased unit consumption) after 2014 (among which Portugal, Greece, Germany, Ireland, Romania, Hungary).
At the EU 27 level, the decreasing trend of energy consumption per dwelling is slowing down after 2014 (-1.3%/year for 2000-2014 and -0.2%/year for 2014-2019).
Trends by end-use
The four dominant end-uses, which represent in total 98% of the dwelling consumption, are, by order of magnitude, space heating (65% in 2019), water heating (14% in 2019), appliances (13%) and cooking (6% in 2019) (Figure 3). Lighting and air-conditioning each account for less than 1%. Interestingly, in 2019, the share of energy consumption of appliances has almost exceeded that of water heating.
Figure 3: Household energy consumption by end-use in the EU
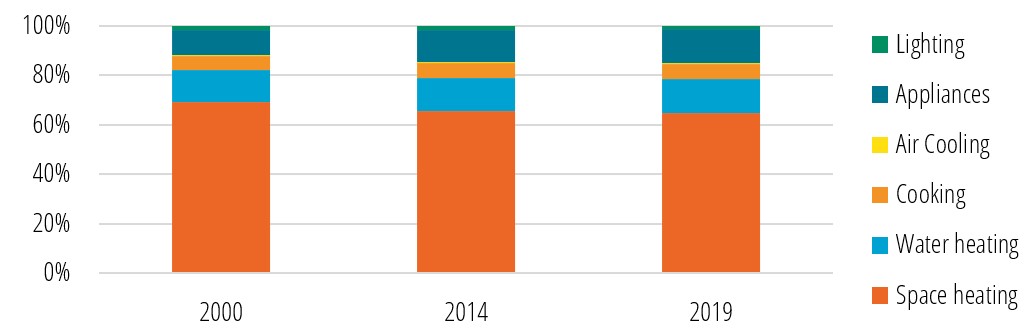
Source: Odyssee
For each of the main end-uses, contrasting trends are observed over time (Figure 4). For household appliances, consumption has been increasing since 2000, but this increase has slowed down since 2014. For domestic hot water, consumption has also been increasing since 2000, but at a rate that has clearly accelerated since 2014 (around 1%/year) compared to 2000-2014 (almost stable). Finally, for space heating, the consumption has been stable since 2014, and follows a period of decline (-0.7%/year over 2000-2014).
Figure 4: Annual growth rate of energy consumption by end-use
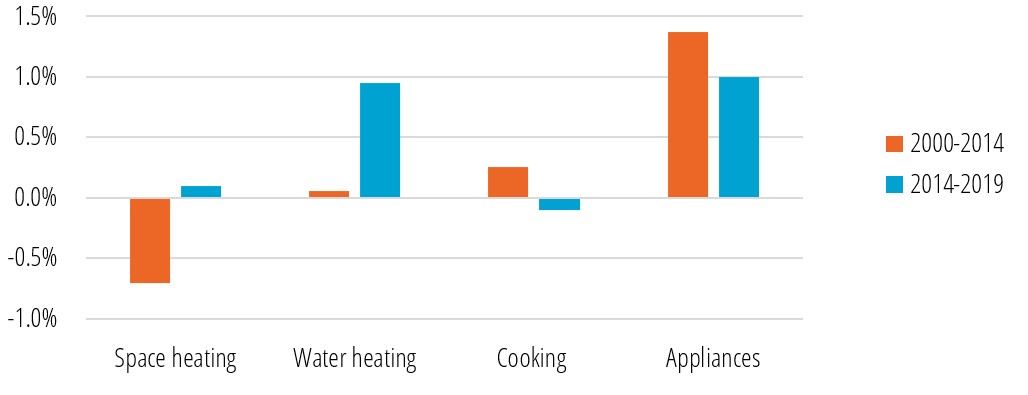
Source: Odyssee
Focus on space heating
For space heating, the reduction of the unit consumption per m2 has significantly slowed down since 2014 in most of the largest EU countries, especially in Germany, France, UK and The Netherlands (Figure 5). At the EU 27 level, the unit consumption for space heating has decreased from 2.1%/year over 2000-2014 to 0.6%/year since 2014.
Figure 5: Households heating consumption per m2 (climate corrected)
Source: Odyssee
*Notes: 2002 for UK, 2003 for Portugal; no data available before 2008 for Luxembourg and before 2016 for Malta. No data on m2 for Belgium
The trends by country for heating consumption per m2 of dwellings (Figure 5) mostly correspond to those observed for household energy consumption (Figure 4).
Energy efficiency trends in households
How is measured energy efficiency progress of households in Odyssee?
In Odyssee, an overall energy efficiency index, called "ODEX", aggregates the specific consumption trends by end-use to measure overall energy efficiency progress at sectoral level. Specifically, ODEX1 is calculated by weighting the index of each end-use by the share of the end-use in the sector's energy consumption. The households ODEX is currently calculated on the basis of 11 household end-uses or appliances2.
The advantage of this approach is to aggregate specific consumption trends initially expressed in different physical units (e.g., toe/m2 for heating, toe/household for water heating and cooking, kWh/household for lighting, kWh/appliance for appliances and cooling) to get as close as possible to the energy efficiency of each technology, through (dimensionless) variation indices.
Energy efficiency trends for households at EU level
Household energy efficiency has improved by 29% at EU level between 2000 and 2019 (or 1.8%/year) as shown by the energy efficiency index “ODEX” (equal to 71 in 2019, Figure 6). However, a significant slowdown has been observed since 2014: the reduction in ODEX has been twice lower, mainly because of limited efficiency gains for space heating (the largest end-use), and, to a lower extent, water heating and cooking. The downward trends of energy efficiency observed for these end-uses were not offset by the larger efficiency gains for large appliances and lighting.
Figure 6: Trends in household energy efficiency at EU level, according to ODEX
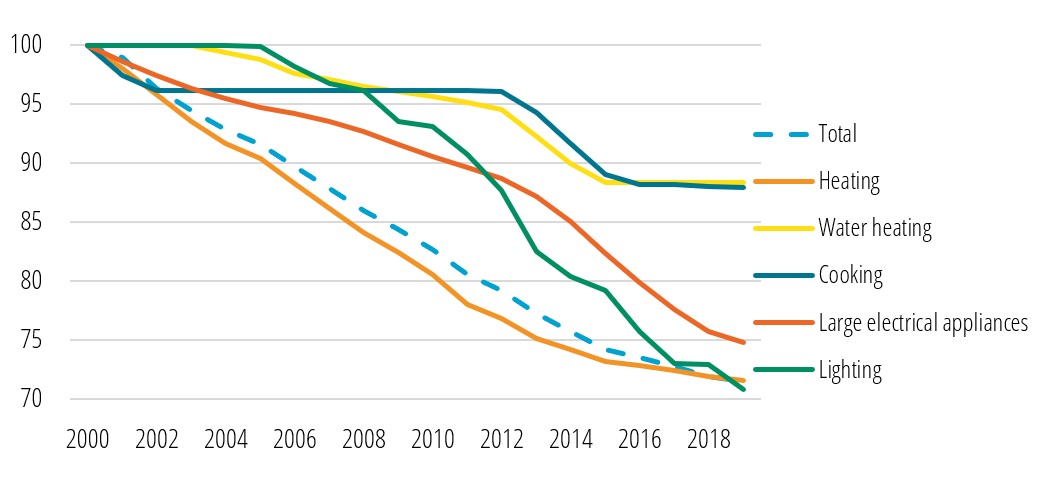
Source: Odyssee
Heating, water heating, cooking, cooling, lighting, refrigerators, freezers, washing machines, dishwashers, dryer and TVs
How can we explain energy efficiency and energy consumption trends after 2014?
Changes in energy consumption can be linked to several factors, such as changes in the technical progress of heating systems and associated energy efficiency gains. The ODEX analysis shows that energy efficiency gains in heating use have tended to decrease since 2014 (Figure 5). Several aspects can explain this phenomenon:
- Less new construction, that have very high energy efficiency performance: the rate of construction has decreased by 35% since the financial crisis. Because of this low rate of new construction (it represents every year only 0.8% of the existing stock of dwellings), the high efficiency of new dwellings had little impact on the overall efficiency of heating.
- The quality of renovation of existing dwellings3: conventional retrofits focus on improvements of isolated systems (i.e., heating systems, refurbishment of carpentry) as they are simple and quick to implement3; however, they often miss the opportunity for saving more energy in a cost-effective manner. There may be also an emergence in some countries of Do-It-Yourself retrofits, carried out at lower cost, but which may be technically less efficient than when carried out by trained craftsmen. In these cases, the full energy saving potential of a building is not exploited, and often cannot be exploited in the future for technical or financial reasons. The implementation of deep energy renovation4 based on an integrative approach at the whole building level allows for a more cost-effective process and for a higher energy savings.
- The use of low-performance back-up systems for fuel-poor households: when energy prices are high, fuel-poor households tend to swap their fuel for a directly available and free resource (wood or waste, burnt in open fireplaces with lower efficiency); or for a resource that they can pay for as they use it.
- Low energy prices which do not encourage renovation work with long payback periods and lead to higher heating temperature (rebound effect)5.
Figure 7 illustrates the impact of the main drivers of household energy consumption. Between 2000 and 2019, the household consumption has decreased by 8.5 Mtoe. Increases in housing stock and more consuming lifestyles (more appliances and larger homes) have contributed to an increase in consumption of 72.5 Mtoe. Energy savings have more than offset this increase by reducing consumption by 86.5 Mtoe. The warmer climate in 2019 further reduced consumption by 2 Mtoe.
Figure 7: Drivers of household energy consumption at EU level
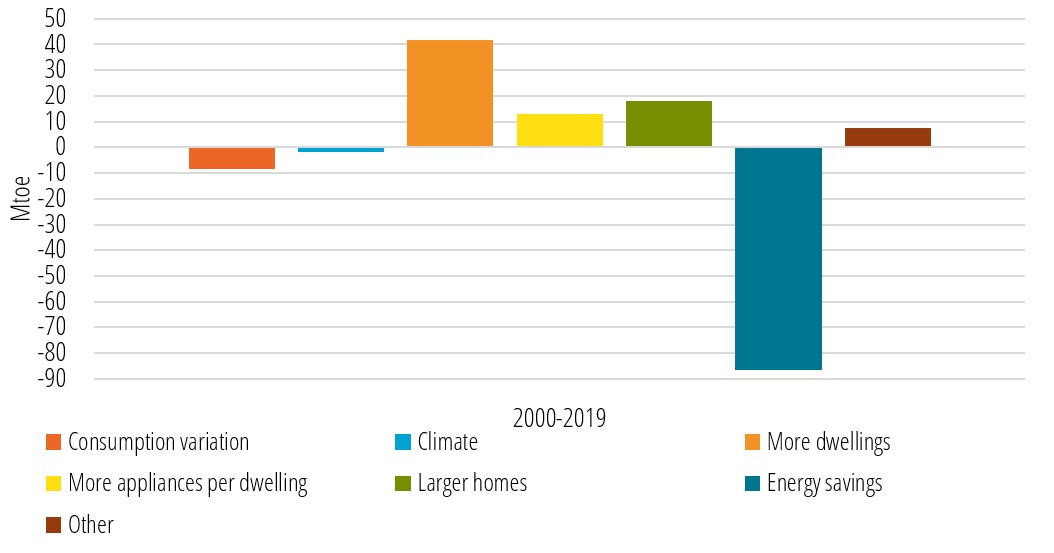
Source: Odyssee
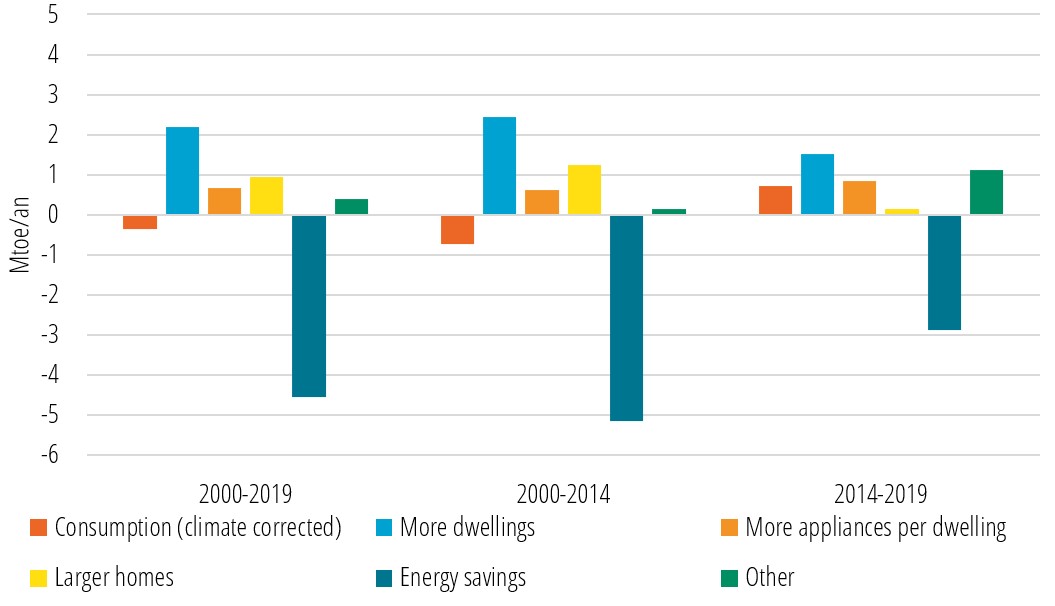
A further analysis of the decomposition of effects can be done by looking at the average annual effects (climate corrected for heating) for each period (Figure 8). The household energy consumption (climate corrected) decreases of about 0.7 Mtoe/year for 2000-2014 and increased of about 0.7 Mtoe/year after. These trends can be explained by the combination of contrasting trends on each effect:
- Mean annual energy savings drop from 5 Mtoe/year before 2014 to 3 Mtoe/year after, which confirms the slowdown in energy savings discussed above.
- Among the activity effects, which tend to increase energy consumption, some of them decrease after 2014, such as “more dwellings” or “larger homes”, while the “more appliances” effect slightly increases. The overall evolution of these 3 non-behavioural effects is downwards, as they increased energy consumption on average by 2.5 Mtoe/year before 2014 and by 1.8Mtoe/year after.
- The "other" effects, which essentially include behavioural effects, contribute to the increase in consumption after 2014. These rebound effects, or effect related to consumer’s tendency to consume more energy due to economic benefit from efficiency improvement. These effects can be of several types, e.g., direct (increase in consumption of heating energy because of better insulated homes or more efficient heating systems), energy market related (energy consumption increases as fuel costs decreases, as it has been the case in Ireland after 2014)6.
Figure 8: Trends of the drivers of household energy consumption at EU level for various periods
Source: Odyssee
CONCLUSION:
Our analysis of energy consumption trends in the building sector based on data from the Odyssee project highlights a break in the trend after 2014 linked to two phenomena: the slowdown in energy efficiency progress after 2014 and the growing importance of behavioural effects in energy consumption.
This work confirms the importance of monitoring and exploiting energy data at fine levels of detail in order to better understand the energy behaviour of household sector. However, despite the abundance of data available, and identified explanatory factors (decreasing share of new housing, retrofit practices, heating systems of energy poor households, rebound effect...) we note that it is still difficult to provide detailed explanations of the identified phenomena. Efforts still need to be made to collect technical and activity data, in particular on the quality and volume of renovations in each country, as well as data on the behaviour of households (use of technical and control systems; perception of comfort; influence of energy prices on behaviour, etc.)
Notes:
- ODEX Indicators Definition
- Heating, water heating, cooking, cooling, lighting, refrigerators, freezers, washing machines, dishwashers, dryer and TVs
- For example, in France 35% of the renovation works between 2014 and 2016 were over one aspect only. More details in the Enquête Tremi report (ADEME, 2017)
- See the Energy Efficiency Directive 2012/27/EU. A deep renovation is a “refurbishment that reduces both the delivered and the final energy consumption of a building by a significant percentage compared with the pre-renovation levels, leading to a very high energy performance”
- Boosting Building Renovation: What potential and value for Europe? 2016, Directorate general for Internal Policies (European Parliament)
- SIEA, personal communication