Sovereignty, energy and the next wave of growth
Request this Executive Brief in PDF format (FREE)
The last ten years have been marked by rapid growth in Data Centres worldwide. Critical infrastructures, they provide the computing, storage, and networking capabilities required to support cloud services, artificial intelligence (AI), and an increasingly connected world. As organisations accelerate their digital transformation, Data Centres have evolved from traditional facilities focused on IT operations into strategic assets that enable business innovation, resilience, and competitive advantage.
The strong growth in AI demand is driving unprecedented demand for Data Centre capacity worldwide. In this context, can restrictive measures (moratoriums, connection limits, environmental constraints, social acceptance) and economic factors (electricity prices, taxation, access to land) really slow down the development of Data Centres, or do they merely shift their geographical location?
Data Centres: a new sector in the energy system?
Definitions, architecture and market segments
Data Centres (DCs) are large tertiary buildings, formally part of the services sector, connected to telecommunications networks and consuming electricity that is, in most cases, sourced from the grid. Inside, IT equipment performs computation and stores data, drawing power continuously. Driven by new digital uses, the rise of AI and a highly innovative supplier base, the computing power of IT equipment per installation square meter has increased roughly tenfold over the past decade from 2 kW/m² to more than 20 kW/m². This equipment generates heat that must be extracted and dissipated through supporting infrastructure (i.e. non-IT equipment), including cooling systems and auxiliary equipment, which also consumes electricity.
Three main types of Data Centres can be distinguished:
- Enterprise Data Centres: DCs owned and operated by an organisation to house its own IT infrastructure. they are typically smaller and less efficient than other types of Data Centres.
- Colocation Data Centres: facilities owned and operated by independent providers, where multiple organisations can host their IT infrastructure within a shared site.
- Hyperscale Data Centres: very large DCs designed to provide computing, storage and data processing capabilities on a very large scale, with high scalability. they are primarily used for cloud computing, artificial intelligence, High-Performance Computing (HPC), data storage and global digital services. Massive technology companies (like Amazon Web Services, Google, Meta, and Microsoft) either self-build their Data Centres or lease massive amounts of space from a third-party Data Centre provider (like Equinix, Digital Realty, etc.).
DC growth is mainly driven by colocation and hyperscale Data Centres.
New sector, new energy demand
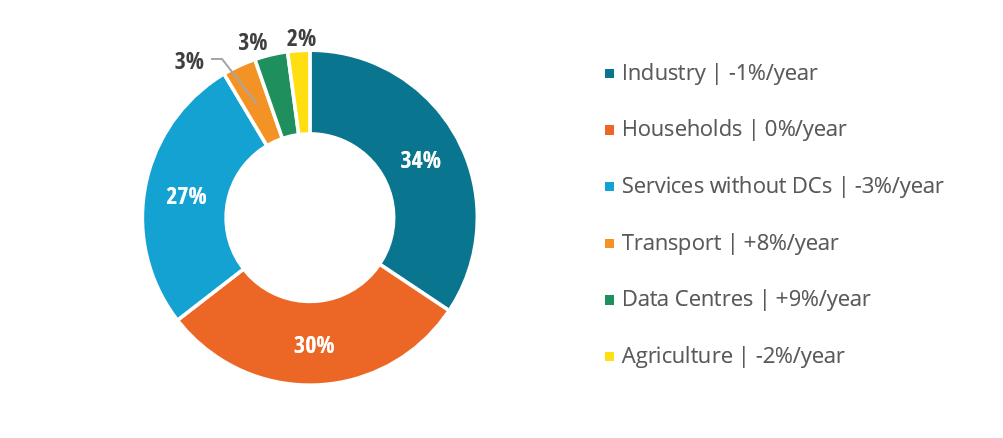
Behind every search query, every streamed film, and every AI prompt sits a Data Centre, a building whose sole purpose is to convert electricity into information. DCs are the factories of the digital economy: they consume electricity, produce computation, and reject heat. DCs are rapidly emerging as a new final-energy-consumption sector, just like transport, industry, or residential buildings.
Crucially, and unlike electrified industrial processes, electric vehicles, or electric heating, which improve energy efficiency by substituting fossil consumption, DCs represent a net new electricity demand serving new uses.
This is why Enerdata explicitly modelled Data Centres in its global multi-sector scenarios. Under most plausible trajectories, DCs will warrant treatment as a distinct final-consumption sector by the early 2030s.
Figure 1: Electricity consumption in the EU27 in 2025 share by sector and 5 years historical trends
Source: Enerdata, EnerFuture
Behind Data Centre demand growth: digitalisation and AI
Data Centre electricity demand is being driven by the rapid expansion of digital services (including video streaming, financial platforms, online gaming, social media), as well as the growing adoption of cloud computing, AI applications (both training and inference), high performance computing and cryptocurrency mining.
A key challenge is distinguishing AI from other digital uses. Between 2000 and 2020, most of the energy footprint of digital services increasingly shifted towards end-user devices (smartphones, PCs, displays). With the rapid rise of AI, this trend is reversing: DCs are now accounting for a growing share of the digital sector’s energy footprint.
A useful way to assess AI-related electricity demand is to distinguish between four broad categories of workloads1, each with very different computing and energy requirements:
- Traditional Machine Learning represents the most mature class of AI applications. Its computing requirements are generally moderate and its energy consumption per query remains relatively low.
- Generative AI model training, particularly for large language models (LLMs), sits at the other end of the spectrum. These models require massive amounts of computing resources and substantial electricity consumption, often concentrated in specific locations and over relatively short periods.
- Generative AI inference, which consists of running trained models in production, is less energy-intensive on a per-query basis. However, as AI services become embedded across millions of users, applications and business processes, inference is expected to become the main driver of long-term electricity demand growth.
- Multimodal and agentic AI systems, which combine text, images, audio, video and autonomous decision-making capabilities, are still emerging, and their future energy requirements remain highly uncertain but could substantially increase total AI-related energy consumption.
Over the past two decades, the digital sector has achieved remarkable efficiency gains: computing power per unit of energy has improved dramatically, data transmission has become more energy-efficient, and storage costs have fallen continuously.
In theory, these improvements should have reduced overall energy consumption. In practice, however, lower costs and higher performance have stimulated new uses and massive growth in demand. The rise of cloud computing, video streaming, social media, cryptocurrencies and, more recently, artificial intelligence, illustrates this rebound effect. As a result, global DC electricity consumption increased by 14%/year between 2015 and 2025 to around 540 TWh in 2025.
Technological and economic drivers Data Centre growth
Data Centre deployment is highly concentrated geographically, reflecting the importance of a range of location-specific factors.
Site selection is driven by the availability of high-quality telecommunications infrastructure, access to reliable and competitively priced electricity, the presence of established digital ecosystems and cluster effects, grid connection and permitting lead times, the regulatory and policy environment, investment trends, and the availability of fiscal or regulatory incentives. These factors create strong agglomeration effects, leading to the emergence of a limited number of global Data Centre hubs.
The main US cluster is in Northern Virginia, while Europe’s leading hubs are Frankfurt, London, Amsterdam, Paris and Dublin (FLAP-D). Singapore, Tokyo, Hong Kong and Sydney are the main hubs for Asia-Pacific.
Grid connection and power availability
Limited power availability remains the main limit of global Data Centre growth in certain core hub markets. In Europe, the saturation of traditional Tier 1 hubs (FLAP-D) is forcing a geographic redistribution.
- In Amsterdam and Dublin, waiting times for new connections now reach up to 10 years, effectively halting new projects in these zones until 2028–2030. Dublin ended the 2021-2025 moratorium introducing environmental obligations. All new Data Centres must prove that at least 80% of their annual electricity demand is met by new renewable energy projects located within the Republic of Ireland.
- Growth is shifting toward "secondary hubs" with spare grid capacity, such as Milan, Madrid, Warsaw, and the Nordics.
In the US, secondary markets in Ohio and Texas are absorbing the overflow from Northern Virginia. In several markets, most visibly in the US, utilities are reporting interconnection queues several times larger than realistic build-out, as developers submit multiple speculative requests to secure optionality on sites.
Behind the meter models are emerging to reduce time to market (mainly for hyperscalers), with either renewables coupled with large scale storage (Battery Energy Storage Systems) or where gas pipelines are available some operators are installing on-site gas turbines to generate their own power while they wait years for a grid connection. Some big tech companies have planned to connect their hyperscalers to nuclear power plants, such as Microsoft which signed a major deal to restart a reactor at Three-Mile Island specifically for its own needs.
Navigating electricity price spikes
In data-centre-heavy states such as Virginia, electricity prices have increased significantly, leading to a "ratepayer protection" backlash.
- Regulators (notably in Texas) are beginning to move away from spreading infrastructure costs across all consumers. New frameworks require large loads (>75 MW) to bear a higher share of transmission upgrade costs, which may dampen the "gold rush" for lower-tier developers.
- Large hyperscalers (Amazon, Google, Microsoft) have contracted nearly 50 GW of renewables via PPAs to hedge against price volatility and secure green credentials.
These contrasting regional dynamics are amplified by uncertainty on both demand and supply sides, particularly regarding AI adoption rates, infrastructure build-out pace, and the availability of reliable and affordable electricity.
AI infrastructure boom: growth amid uncertainty
The rapid expansion of Data Centres, driven by AI, is occurring in a context where the underlying economic model remains unstable. Hundreds of billions of USD are being committed to AI infrastructure ahead of a clear, validated monetisation path.AI business models, enterprise willingness to pay for state-of-the-art models, and the durability of current market capitalisation among AI-related companies are all open questions that imply new challenges across the value chain. Equipment manufacturers face significant uncertainty regarding future demand and must determine how quickly to scale production of AI-specific infrastructure such as advanced cooling systems, transformers, switchgear and backup power equipment. Grid operators are confronted with increasingly complex planning decisions, including distinguishing genuine load growth from speculative connection requests, prioritising network reinforcements. At the same time, power producers coordinate investment plans to meet emerging demand from DCs and the electrification of other end-uses. Granted AI is expected to trigger energy efficiency gains in various sectors, such as industry through process optimisation, transport through autonomous systems and buildings through smart controls, making its net effect on global energy demand still uncertain.
Future Data Centre consumption trends
While the future trajectory of AI remains highly uncertain—driven by factors such as the pace of technological breakthroughs, regulatory developments, adoption rates, efficiency improvements, and potential rebound effects—these uncertainties do not diminish the need for quantitative modelling. Data Centres are becoming a strategic component of the energy system in a few countries, with the potential to significantly influence electricity demand, infrastructure investment, and decarbonisation pathways. Given the wide range of plausible futures, prospective modelling provides a structured framework to explore alternative development trajectories, test key assumptions, and assess system-level implications under different scenarios. Rather than attempting to predict a single outcome, Enerdata's scenario approach helps capture the possible evolutions of the sector and ensures that long-term energy outlooks remain robust.
Modelling Data Centre energy consumption
The modelling framework is integrated within Enerdata’s cross-sectoral POLES–Enerdata system, ensuring internal consistency across energy demand, supply, and prices. It explicitly accounts for lead times, grid constraints, energy price signals, regulatory frameworks, and expected efficiency improvements.
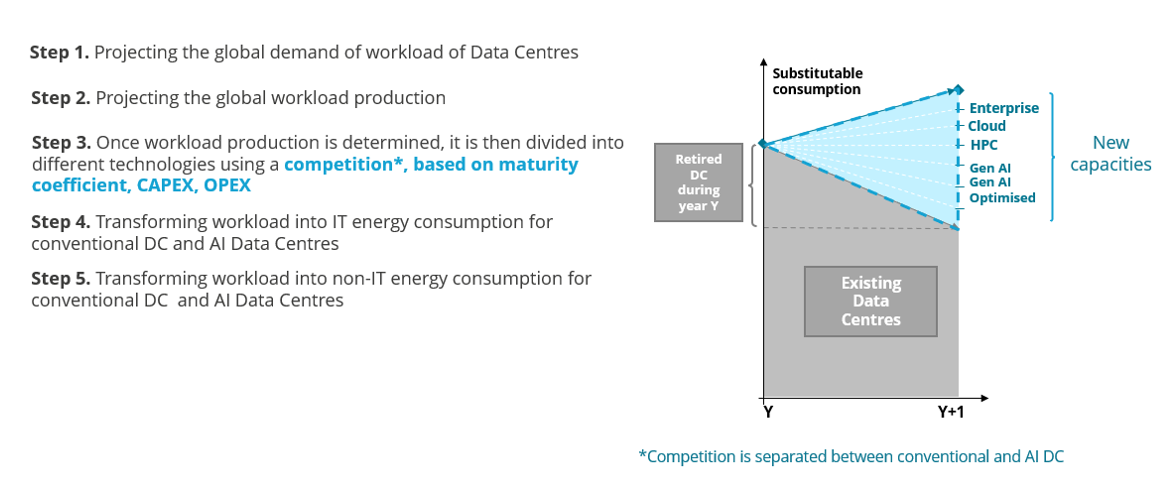
DC modelling is based on an activity variable called workload, which is divided into two categories: conventional and AI. The workload demand is defined for each country as a proxy for the need for digital services (AI, inference, 5G, IoT, video streaming). In the modelling, each year, a competition at national level occurs in the model to match workload production with demand at a global level. This competition is based on CAPEX of Data Centres, electricity prices and coefficients accounting for non-monetary incentives and regulations in each country.
Figure 2: Workload competition steps within Enerdata’s Data Centre model
Source: Enerdata, EnerFuture
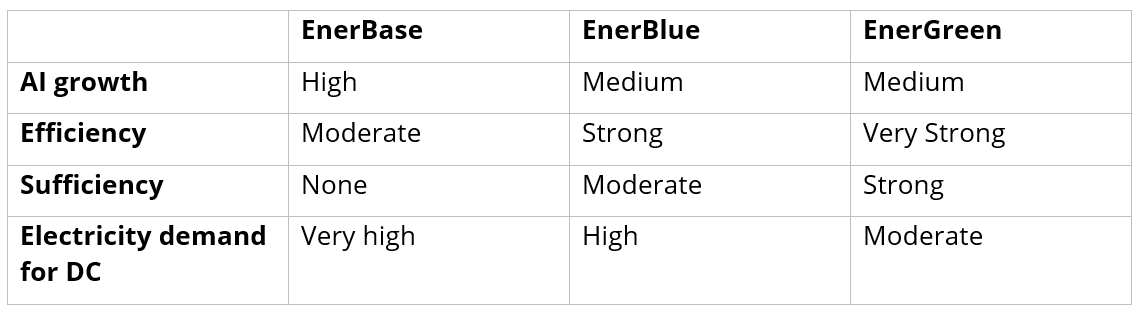
Based on this modelling framework, three contrasted scenarios are developed to reflect uncertainties related to AI diffusion, efficiency gains, and energy-system constraints:
- EnerBase: a continuation of current trends, with strong workload growth and no significant behavioural change. AI expansion drives demand, partly offset by steady efficiency improvements, including optimised AI models, enhanced IT performance, and gradual PUE (Power Usage Effectiveness2) gains.
- EnerBlue: a trajectory aligned with countries’ NDC commitments. Workload growth remains robust but is moderated by sufficiency efforts. Efficiency gains are stronger than in EnerBase, supported by a higher share of optimised AI and accelerated technological improvements in IT equipment and cooling systems.
- EnerGreen: a pathway combining sustained workload growth with ambitious sufficiency measures and significant efficiency gains. As a result, electricity demand evolves at a pace compatible with the Paris Agreement, supported by a strong deployment of renewable energy to maintain the Net Zero trajectory.
Figure 3: Main modelling assumptions of the 3 EnerFuture scenarios for Data Centres
Source: Enerdata, EnerFuture
A strong driver of electricity demand
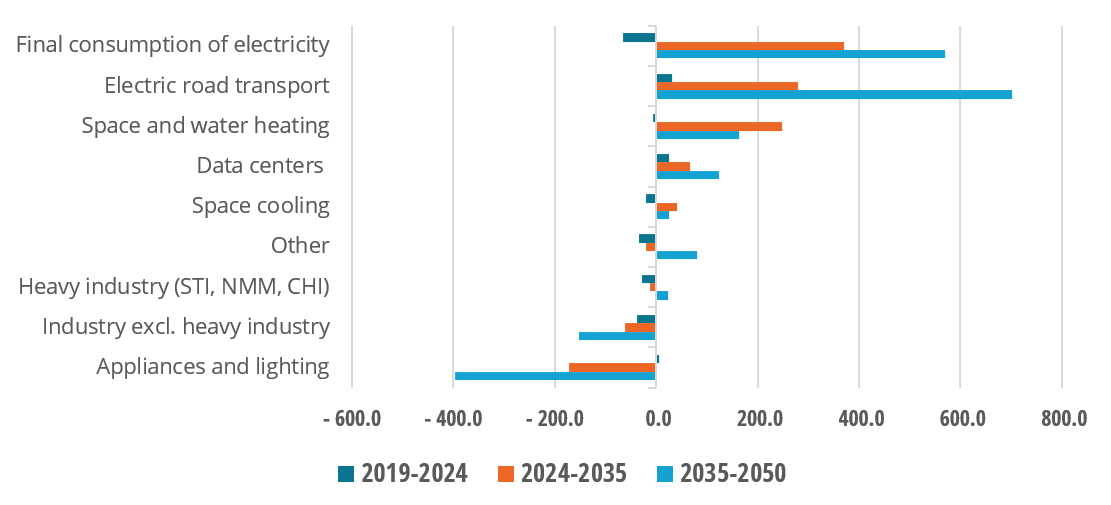
The electrification of the EU economy has been lagging over the 2019-2024 period, with a 65 TWh decrease in electricity consumption. Electrification of road transport and Data Centres were the two main sectors where the power demand significantly increased, partially mitigating the decrease in electricity demand, notably in industry.
In the next decade, under the EnerBlue scenario, the Data Centre sector will be the fourth-largest driver of electrification in the EU, with roughly 70 TWh of extra demand, much below space and water heating (+250 TWh) and road transportation (+280 TWh). Between 2035 and 2050, the increase of electricity demand from Data Centres will be only 20 % below the space and water heating sector with an additional 124 TWh.
Figure 4: Increase in electricity demand by sector in EU27 (EnerBlue)
Source: Enerdata, EnerFuture
How to measure digital sovereignty?
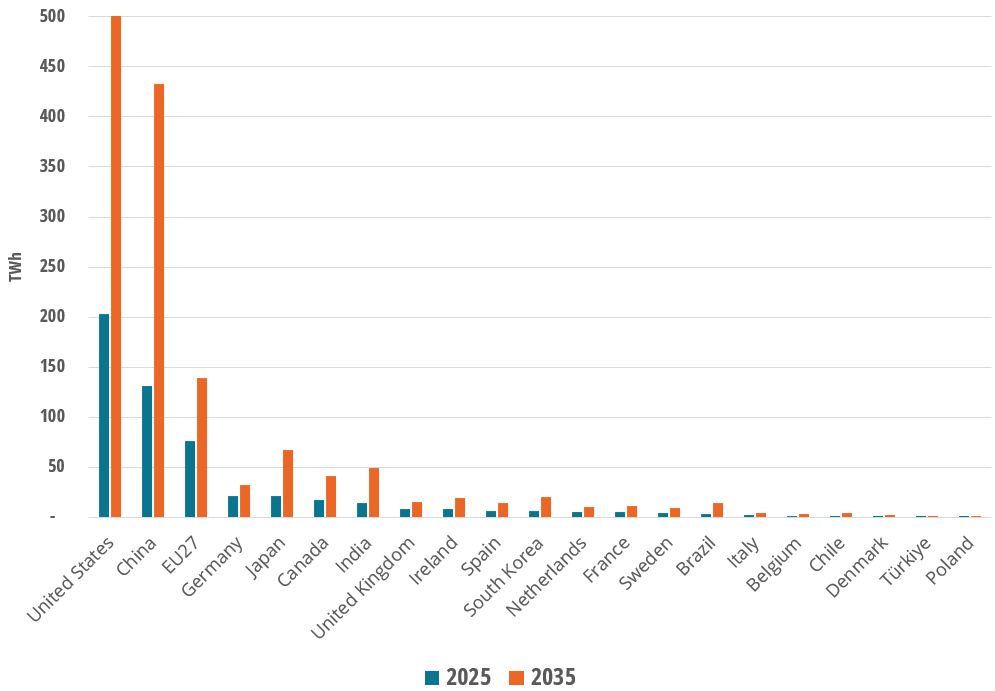
It is no easy task to define digital sovereignty of a country, as very little data relating to the imports and exports of digital services is available. Digital sovereignty can be defined as the ability of a country to meet its digital demand through infrastructure, computing capacity, data storage and digital services that it can effectively govern and control. A digitally sovereign country is not necessarily self-sufficient, but it maintains a sufficient domestic digital capacity to avoid excessive dependence on foreign infrastructures for critical economic, governmental and societal functions. DC electricity consumption per capita (kWh/cap) can be interpreted as a proxy for the amount of digital infrastructure hosted relative to the size of the domestic market. Countries with average Data Centre energy consumption per capita above the median value of 2025 (120 kWh/cap) may appear to host substantially more computing infrastructure than would be required by their domestic population alone, suggesting they are likely net exporters of digital services.
On the contrary countries below the median are more likely to import more digital services than produce them locally, implying greater dependence on foreign infrastructure.
Ireland and the USA are the most staggering example of countries with very high per capita energy consumption. Ireland also combines a massive concentration of hyperscale infrastructure owned by American tech companies. Unlike Ireland, the USA combines a large domestic digital demand, a large export capacity and global tech companies which correspond to what could be called a digital sovereign power. A second group composed of the UK, Canada, Sweden, the Netherlands and Denmark could also be considered exporters as they are above the median.
Figure 5: Energy consumption per capita and total energy consumption of Data Centres for various countries (EnerBlue)
Source: Enerdata, EnerFuture
In Enerdata’s DC model, workload production and workload demand are computed to simulate potential exports and imports of digital services. Therefore, using a ratio of workload production to workload demand as a proxy of digital sovereignty is possible, but it remains a first approach. It is important to keep in mind that per capita energy consumption is only a first measurement to indirectly assess digital sovereignty, as a country can host many Data Centres and at the same time heavily rely on foreign hyperscalers for strategic affairs. A deeper review of the digital ecosystem of each country (tech companies, Data Centre infrastructures, private data regulations, etc) and the hidden dependencies would be necessary to better understand the level of digital sovereignty of each country.
To conclude, rather than limiting growth, most of these constraints appear to be reshaping where and how data centres are deployed. The saturation of historical hubs such as Amsterdam, Dublin, Northern Virginia, or Singapore is encouraging a geographical redistribution toward secondary markets with greater power availability and faster permitting processes. At the same time, concerns surrounding data centres are becoming increasingly visible. Excessive water consumption, fears of higher electricity bills for households and industries, pressure on local grids, land-use conflicts, very few local jobs, while global technology companies capture most of the economic benefits, are fuelling opposition to new projects.
Nevertheless, the underlying drivers of demand remain exceptionally strong, Enerdata forecasts in its three scenarios a strong increase in electricity demand from data centres up to 2035 (multiplied by 2.5 in the central EnerBlue scenario). Unlike many other forms of electrification that substitute fossil fuel consumption, data centres represent a largely new source of electricity demand. The pace of AI adoption, future efficiency gains, and the long-term viability of some business models remain uncertain. Despite these uncertainties, countries and regions that can provide affordable low-carbon electricity, sufficient grid capacity, efficient permitting procedures, and a stable investment environment are likely to capture a significant share of future data centre investment and reinforce their digital sovereignty.
KEY TAKEAWAYS
- Grid congestion is the main limit to the development of DC infrastructure and moratoriums tend to favour Tier – 2 hub development
- Digital sovereignty is a complex concept that is hard to catch only with quantitative data
- Despite the high uncertainties in the DC sector (potential technological breakthrough, rebound effect, energy efficiency gains, t), prospective scenarios are useful for capturing potential developments of the DC sector relative to other drivers of electricity demand
- In the next decade, under the EnerBlue scenario, Data Centre sector will be the fourth-largest driver of electrification in the EU, with roughly 70 TWh of extra demand, much below space and water heating (+250 TWh) and road transportation (+280 TWh).
Notes:
- A data centre workload is the amount of processing work, memory, storage, and network capacity required to run a specific application, service, or computational task
- PUE is a metric that measures the energy efficiency of a data centre by comparing total energy consumption to the energy used by IT equipment