
- Update
- Format
- 3 files (PDF report, 2 Excel files)
- Pages
-
49 (Report only)
- Delivery
- Immediate by e-mail
- GENERAL OVERVIEW
- ENERGY AND CLIMATE POLICY FRAMEWORK
- ENERGY COMPANIES
- ENERGY SUPPLY AND DEMAND
- ENERGY USE AND PRICE BY SECTOR
- ISSUES AND PROSPECTS
- STATISTICS
- ABBREVIATIONS
- GLOSSARY
Buy Uruguay energy report
Price without VAT. Depending on your status and location, VAT might be applicable. Get in touch with us for more information.
After validation, you will immediately receive 3 files by email (one pdf report and 2 excel files containing the datasets).
Overview
Uruguay’s energy strategy prioritises diversification, reducing oil and hydroelectric dependence while advancing renewables and efficiency. Governed by robust regulatory frameworks, the nation has achieved high renewable integration, with biomass and wind leading the transition. Ambitious green hydrogen plans and ongoing energy market reforms further support its low-carbon and sustainable growth objectives.
Get more details on the table of contents and data files, as well as the list of graphs and tables by browsing the tabs below.
Highlights
- The energy policy aims to diversify the energy mix, to reduce reliance on oil and hydroelectricity, and to promote energy efficiency.
- UTE supplies more than 60% of the country's electricity and controls transmission and distribution.
- Ancap is the main oil and gas company.
- Renewables represented 99% of the power mix in 2024.
- Bimass accounts for 51% of the energy mix.
- Final consumption has increased very rapidly since 2023 (11%/year), driven by industry, which absorbed 50% of this consumption. Biomass is the main energy source (46%).
- Energy prices are among the highest in South America.
- A first pilot project was launched with funding of $10M under the Green Hydrogen Sector Fund to decarbonise heavy transport.
- The 7 offshore blocks that were open for hydrocarbon exploration under the "Uruguay Open Round" bidding process have all been awarded.
Energy & Climate Policy Framework
The Ministry of Industry, Energy, and Mines (MIEM) oversees the energy sector through the National Energy Department (DNE). However, the Salto Grande hydroelectric plant, shared between Uruguay and Argentina, falls under the direct management of the Ministry of Foreign Relations.
Energy Companies
Electricity:
UTE, Administración Nacional de Usinas y Trasmisiones Eléctricas, is the nationalvertically-integrated public power utility. UTE's capacity stood at 2 250 MW at end-2024. Under the terms of the new electricity sector regulations, UTE can acquire up to 40% of any project for the construction of new power plants.
Energy Supply & Demand
Resources:
Similar to its immediate neighbours, Uruguay has significant hydroelectric resources, particularly along the Uruguay River, which it partially exploits in collaboration with Argentina. Out of theoretical resources of 32 TWh, only 7.2 TWh are considered economically exploitable.
Energy Use and Price by Sector
Energy Prices in Residential:
Electricity prices for households have dropped slightly (-1.4%) to US$20.2c/kWh. It is quite stable over the long run because of the regulations and a power generation mix with little exposure to international prices. Conversely, natural gas prices are heavily driven by international prices that lead to severe variations from one year to another.
Issues & Prospects
Electricity:
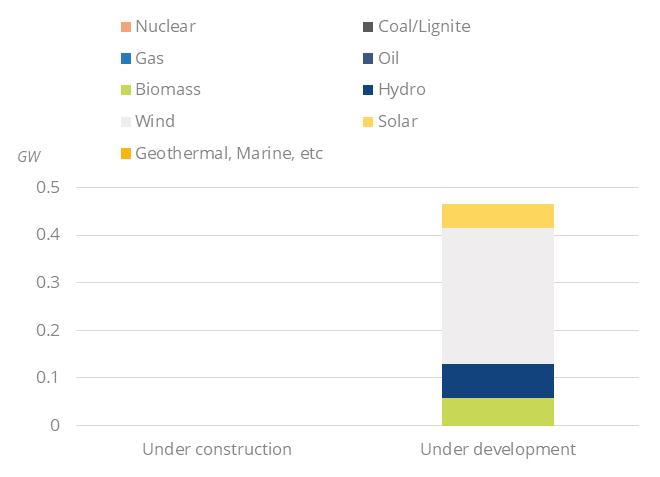
According to the base scenario of the Electricity expansion plant 2024-2043 ofDecember 2024, the country plans to add 2.1 GW of wind, 1.1 GW of solar PV, and 0.5 GW of gas-fired power capacity by 2024.
Graph: Upcoming New Capacity by Energy Source
- Graph 1: Primary Consumption Trends by Energy Source
- Graph 2: Total Consumption Market Share by Energy (2024)
- Graph 3: Installed Electric Capacity by Source
- Graph 4: Installed Electric Capacity by Source (2024)
- Graph 5: Gross Power Production by Source & Consumption
- Graph 6: Power Generation by Source (2024)
- Graph 7: Crude Oil Production & Consumption
- Graph 8: Petroleum Products Production & Consumption
- Graph 9: Gas Production & Consumption
- Graph 10: Emissions of GHG and CO2 from Fuel Combustion
- Graph 11: Final Demand Trends by Energy Source
- Graph 12: Final Consumption by Sector
- Graph 13: Final Consumption Market Share by Sector (2024)
- Graph 14: Final Consumption in Industry by Energy Source
- Graph 15: Energy Prices in Industry (Taxes Included)
- Graph 16: Final Consumption in Transport by Energy Source
- Graph 17: Energy Prices in Transport (Taxes Included)
- Graph 18: Final Consumption in Residential, Services, Agriculture by Energy Source
- Graph 19: Energy Prices in Residential (Taxes Included)
- Graph 20: Upcoming New Capacity by Energy Source
- Economic Indicators: Annual historical data including population, GDP growth, imports and exports, inflation rate, energy security and efficiency indicators, CO2 emissions.
- Supply Indicators: Historical data including oil and gas reserves, electric and refining capacity, energy production, power production and external trade. All are detailed by energy source.
- Demand Indicators: Historical data including consumption per inhabitant, consumption trends, total consumption by energy source, final consumption by energy source and sector, and electricity consumption by sector.
- Energy Balances: Single table displaying the overall energy industry balance per annum, also graphically displayed by energy sub-segment.
The Uruguay energy market data since 1990 and up to
is included in the Excel file accompanying the Uruguay country report.
It showcases the historical evolution, allowing users to easily work with the data.
Key Data included in the excelsheet:
- Economic indicators: Annual historical economic indicators, energy security, energy efficiency and CO2 emissions.
- Supply indicators: Annual historical reserves, capacity, production and external trade (imports(+) exports(-) balance).
- Demand indicators: Annual historical consumption per capita, consumption trends, total consumption, final consumption (per energy and per sector) and electricity consumption total and per sector.
- Energy Balance: total and per energy.
- Uruguay Energy Prices: In addition to the analysis provided on the report we also provided a data set which includes historical details on the Uruguay energy prices for the follow items: price of premium gasoline (taxes incl.), price of diesel (taxes incl.), price of electricity in industry (taxes incl.), price of electricity for households (taxes incl.), price of natural gas in industry (taxes incl.), prices of natural gas for households (taxes incl.), spot price of Brent and CO2 emissions (from fuel combustion).