
- Update
- Format
- 3 files (PDF report, 2 Excel files)
- Pages
-
59 (Report only)
- Delivery
- Immediate by e-mail
- GENERAL OVERVIEW
- ENERGY AND CLIMATE POLICY FRAMEWORK
- ENERGY COMPANIES
- ENERGY SUPPLY AND DEMAND
- ENERGY USE AND PRICE BY SECTOR
- ISSUES AND PROSPECTS
- STATISTICS
- ABBREVIATIONS
- GLOSSARY
Buy Tanzania energy report
Price without VAT. Depending on your status and location, VAT might be applicable. Get in touch with us for more information.
After validation, you will immediately receive 3 files by email (one pdf report and 2 excel files containing the datasets).
Overview
Tanzania is advancing its energy transition with ambitious targets to expand renewable energy, enhance efficiency, and achieve universal electricity access by 2030. Governed by robust policies and regulatory bodies, the sector prioritises gas, hydropower, and off-grid solutions while fostering private investment and regional interconnections.
Get more details on the table of contents and data files, as well as the list of graphs and tables by browsing the tabs below.
Highlights
- The country aims to double the share of renewables in its energy mix and to decrease its energy intensity by 2.6%/year by 2030.
- Tanesco, a state-owned utility, accounts for around 80% of the power supply.
- Equinor and Shell control large gas reserves.
- Power generation increased by 11% in 2024, after growing by around 5%/year from 2013 to 2023. It is dominated by gas (65%). A 2.1 GW hydropower plant was fully commissioned in early 2025.
- Gas and coal production remains low; the country imports its entire consumption of oil products.
- Biomass is supplying more than 80% of the total consumption.
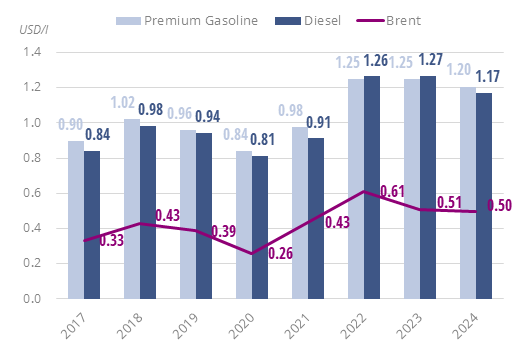
- Diesel and gasoline prices have increased by around 50% since 2020, following global trends.
- The last Power System Master Plan foresees an increase of 7%/year in the power capacity by 2050, to 19.9 GW.
Energy & Climate Policy Framework
The Ministry of Energy (MoE) is in charge of the country's energy policy and development, in particular through the Electricity & Renewable Energy Division and the Petroleum & Gas Division, which was created in 2017 from the partition of the Ministry of Energy and Minerals.
Energy Companies
Gas:
Two companies are producing gas in Tanzania: Pan African Energy Tanzania, an affiliate of Orca, and Morel & Prom. Pan African Energy Tanzania reached a daily production from the Songo Songo Block of 86 mmscfd in Q3 2024 (equivalent to 0.89 bcm per year), while Morel & Prom reached a production of 61.4 mmscfd (0.63 bcm per year) from the Mnazi Bayfield.
Energy Supply & Demand
Gas:
Gas production started in 2004 and has grown at an average pace of 16% per year since then, reaching 2.44 bcm/year in 2024. Natural gas production is mainly carried out in two fields: Mnazi Bay and Songo Songo.
Energy Use and Price by Sector
Energy Prices in Transport:
Graph: Energy Prices in Transport (Taxes Included)
Issues & Prospects
Electricity:
The Power System Master Plan 2024 (PSMP 2024 Update) forecasts a total capacity of 19.9 GW in 2050, up from 3.2 GW in 2024, with the following capacity mix: 43% of non-renewables (including gas and nuclear), 57% of renewables (including 52% of non-hydro renewables).
- Graph 1: Primary Consumption Trends by Energy Source
- Graph 2: Total Consumption Market Share by Energy (2024)
- Graph 3: Installed Electric Capacity by Source
- Graph 4: Installed Electric Capacity by Source (2024)
- Graph 5: Gross Power Production by Source & Consumption
- Graph 6: Power Generation by Source (2024)
- Graph 7: Petroleum Products Production & Consumption
- Graph 8: Gas Production & Consumption (bcm)
- Graph 9: Coal Production & Consumption
- Graph 10: GHG Emissions and CO2-energy Emissions
- Graph 11: Final Demand Trends by Energy Source
- Graph 12: Final Consumption by Sector
- Graph 13: Final Consumption Market Share by Sector (2024)
- Graph 14: Final Consumption in Industry by Energy Source
- Graph 15: Energy Prices Including Taxes in Industry
- Graph 16: Final Consumption in Transport by Energy Source
- Graph 17: Energy Prices Including Taxes in Transport
- Graph 18: Final Consumption in Residential, Services, Agriculture by Energy Source
- Graph 19: Energy Prices Including Taxes in Residential
- Graph 20: Upcoming New Capacity by Energy Source
- Economic Indicators: Annual historical data including population, GDP growth, imports and exports, inflation rate, energy security and efficiency indicators, CO2 emissions.
- Supply Indicators: Historical data including oil and gas reserves, electric and refining capacity, energy production, power production and external trade. All are detailed by energy source.
- Demand Indicators: Historical data including consumption per inhabitant, consumption trends, total consumption by energy source, final consumption by energy source and sector, and electricity consumption by sector.
- Energy Balances: Single table displaying the overall energy industry balance per annum, also graphically displayed by energy sub-segment.
The Tanzania energy market data since 1990 and up to
is included in the Excel file accompanying the Tanzania country report.
It showcases the historical evolution, allowing users to easily work with the data.
Key Data included in the excelsheet:
- Economic indicators: Annual historical economic indicators, energy security, energy efficiency and CO2 emissions.
- Supply indicators: Annual historical reserves, capacity, production and external trade (imports(+) exports(-) balance).
- Demand indicators: Annual historical consumption per capita, consumption trends, total consumption, final consumption (per energy and per sector) and electricity consumption total and per sector.
- Energy Balance: total and per energy.
- Tanzania Energy Prices: In addition to the analysis provided on the report we also provided a data set which includes historical details on the Tanzania energy prices for the follow items: price of premium gasoline (taxes incl.), price of diesel (taxes incl.), price of electricity in industry (taxes incl.), price of electricity for households (taxes incl.), price of natural gas in industry (taxes incl.), prices of natural gas for households (taxes incl.), spot price of Brent and CO2 emissions (from fuel combustion).