
- Update
- Format
- 3 files (PDF report, 2 Excel files)
- Pages
-
51 (Report only)
- Delivery
- Immediate by e-mail
- GENERAL OVERVIEW
- ENERGY AND CLIMATE POLICY FRAMEWORK
- ENERGY COMPANIES
- ENERGY SUPPLY AND DEMAND
- ENERGY USE AND PRICE BY SECTOR
- ISSUES AND PROSPECTS
- STATISTICS
- ABBREVIATIONS
- GLOSSARY
Buy Lao energy report
Price without VAT. Depending on your status and location, VAT might be applicable. Get in touch with us for more information.
After validation, you will immediately receive 3 files by email (one pdf report and 2 excel files containing the datasets).
Overview
Laos is advancing its energy and climate strategy, targeting a significant reduction in greenhouse gas emissions by 2030 while expanding renewable energy and hydropower capacity. Governed by multiple ministries, its policy framework prioritises electrification, energy efficiency, and cross-border power exports, positioning the nation as a key regional energy hub.
Get more details on the table of contents and data files, as well as the list of graphs and tables by browsing the tabs below.
Highlights
- Lao aims to reduce GHG emissions by 60% in 2030 (compared to a BAU), while they were multiplied by 5 since 1990.
- Most of the capacity is operated by IPPs (85%). EDL-Gen, the national power generator, only has 14% of the capacity.
- Hydro dominates the power mix with 76%.
- Lignite production has more than tripled since 2015 with the Hongsa lignite plant commissioning.
- The residential and services sector accounts for 43% of the country's final energy consumption.
- While households consume mainly biomass (70% of their consumption mix), growing electrification and low electricity prices are making clean cooking options more accessible.
- Around 8 GW of power plants are under construction, 90% of which are hydropower plants.
- The country, referred to as the "Battery of Southeast Asia", aims to boost its power export capacity to 14.8 GW, but this objective will probably not be reached.
Energy & Climate Policy Framework
The Ministry of Energy and Mines (MEM) is responsible for the energy sector and operates primarily through five departments: the Department of Energy Policy and Planning (DEPP); the Department of Energy Business (DEB) which is in charge of private sector investments in the power sector; the Department of Energy Management (DEM), which is in charge of drafting energy-related laws, regulations, g
Energy Companies
Oil:
Medco Energi (through the acquisition of Ophir Energy in 2019) is the main foreign player in the exploration of hydrocarbons. It has a 20% stake in the Champasak and Saravan PSC in the Khorat basin.
Energy Supply & Demand
Oil:
In 2007, the Government granted an exploration permit for the Savannakhet area, which is the main zone of interest in the country. Three permits had been granted in the past, but no drillings were carried out and the companies withdrew. Drilling has not started in the Champasak and Saravan PSC.
Energy Use and Price by Sector
Energy Prices in Residential:
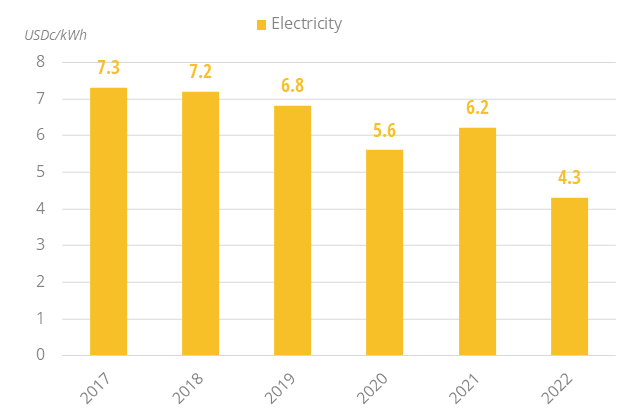
In 2024, the price of electricity was USD 4.3c/kWh for households (i.e. -41% compared to 2017). This price is similar to Malaysia and over half that in Thailand.
Graph: Energy Prices in Residential (Taxes Included)
Issues & Prospects
Electricity:
In 2021, the Ministry of Energy and Mines unveiled a plan to diversify its power mix by developing solar, wind, and coal-fired power plants. The country, which is heavily reliant on hydropower, experiences power shortages during dry seasons and has to import electricity.
- Graph 1: Primary Consumption Trends by Energy Source
- Graph 2: Total Consumption Market Share by Energy (2023)
- Graph 3: Installed Electric Capacity by Source
- Graph 4: Installed Electric Capacity by Source (2023)
- Graph 5: Gross Power Production by Source & Consumption
- Graph 6: Power Generation by Source (2023)
- Graph 7: Petroleum Products Production & Consumption
- Graph 8: Coal Production & Consumption
- Graph 9: Emissions of GHG and CO2 from Fuel Combustion
- Graph 10: Final Demand Trends by Energy Source
- Graph 11: Final Consumption by Sector
- Graph 12: Final Consumption Market Share by Sector (2023)
- Graph 13: Final Consumption in Industry by Energy Source
- Graph 14: Energy Prices in Industry (Taxes Included)
- Graph 15: Final Consumption in Transport by Energy Source
- Graph 16: Energy Prices in Transport (Taxes Included)
- Graph 17: Final Consumption in Residential, Services, Agriculture by Energy Source
- Graph 18: Energy Prices in Residential (Taxes Included)
- Graph 19: Upcoming New Capacity by Energy Source
- Economic Indicators: Annual historical data including population, GDP growth, imports and exports, inflation rate, energy security and efficiency indicators, CO2 emissions.
- Supply Indicators: Historical data including oil and gas reserves, electric and refining capacity, energy production, power production and external trade. All are detailed by energy source.
- Demand Indicators: Historical data including consumption per inhabitant, consumption trends, total consumption by energy source, final consumption by energy source and sector, and electricity consumption by sector.
- Energy Balances: Single table displaying the overall energy industry balance per annum, also graphically displayed by energy sub-segment.
The Lao energy market data since 1990 and up to
is included in the Excel file accompanying the Lao country report.
It showcases the historical evolution, allowing users to easily work with the data.
Key Data included in the excelsheet:
- Economic indicators: Annual historical economic indicators, energy security, energy efficiency and CO2 emissions.
- Supply indicators: Annual historical reserves, capacity, production and external trade (imports(+) exports(-) balance).
- Demand indicators: Annual historical consumption per capita, consumption trends, total consumption, final consumption (per energy and per sector) and electricity consumption total and per sector.
- Energy Balance: total and per energy.
- Lao Energy Prices: In addition to the analysis provided on the report we also provided a data set which includes historical details on the Lao energy prices for the follow items: price of premium gasoline (taxes incl.), price of diesel (taxes incl.), price of electricity in industry (taxes incl.), price of electricity for households (taxes incl.), price of natural gas in industry (taxes incl.), prices of natural gas for households (taxes incl.), spot price of Brent and CO2 emissions (from fuel combustion).