
- Update
-
- Format
- 3 files (PDF report, 2 Excel files)
- Pages
-
60 (Report only)
- Delivery
- Immediate by e-mail
- GENERAL OVERVIEW
- ENERGY AND CLIMATE POLICY FRAMEWORK
- ENERGY COMPANIES
- ENERGY SUPPLY AND DEMAND
- ENERGY USE AND PRICE BY SECTOR
- ISSUES AND PROSPECTS
- STATISTICS
- ABBREVIATIONS
- GLOSSARY
Buy Colombia energy report
Price without VAT. Depending on your status and location, VAT might be applicable. Get in touch with us for more information.
After validation, you will immediately receive 3 files by email (one pdf report and 2 excel files containing the datasets).
Overview
Colombia is advancing a robust energy transition, targeting a significant reduction in greenhouse gas emissions by 2030 while phasing out unabated coal and halting new oil and gas exploration. The strategy prioritises renewable expansion, green hydrogen, and energy efficiency, supported by regulatory reforms and substantial private investment.
Get more details on the table of contents and data files, as well as the list of graphs and tables by browsing the tabs below.
Highlights
- The country targets to cut GHG emissions by 51% in 2030 compared to a BAU scenario.
- The country will not issue new oil and gas exploration contracts and will phase out unabated coal-fired power generation by 2030.
- Three companies, EPM, Enel, and Isagen, hold more than half of the power capacity.
- The public company Ecopetrol dominates the oil and gas sectors.
- Two companies, Drummond and Cerrejón, account for around 75% of the coal production.
- Hydroelectricity dominates the power mix, with a share between 55% and 80% depending on hydro availability (55% in 2024).
- Oil production decreased slightly in 2024, after two years of growth, to 24% below its peak in 2015.
- Coal production has remained stable since 2021, while exports have decreased by 40% since 2017.
- Oil dominates the final energy mix (43%).
- The transport sector is the largest final consumer (38%).
- Gasoline prices have doubled since COVID with the progressive removal of subsidies. Diesel prices should follow in 2025.
- The National Energy Plan 2022-2050 foresees 19 GW of non-conventional renewable capacity by 2050.
- Around 170 bcm of natural gas was discovered in 2024 in the Caribbean Sea.
Energy & Climate Policy Framework
The energy sector is under the responsibility of the Ministry of Mines and Energy (MME). UPME (Mining and Energy Planning Unit) is a special administrative unit of MME in charge of coordinating the planning of the sector.
Energy Companies
Oil:
Ecopetrol (Empresa Colombiana de Petroleos, 88.49% public) dominates the sector with 56% of crude oil production (464 kb/d in 2024). In 2016, Ecopetrol took full control of the Rubiales oil field, the largest in the country, after Pacific Exploration & Production handed over its 43% stake.
Energy Supply & Demand
Gas:
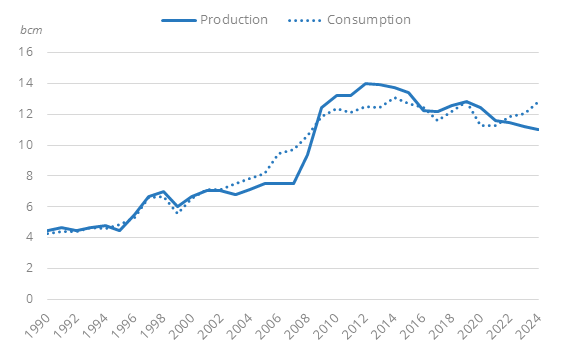
Natural gas production has been decreasing by 3%/year since 2019, resching 11 bcm in 2024; it reached a peak in 2012 at 14 bcm. Since 2022, production does not meet demand and LNG imports are increasing rapidly.
Graph: Gas Production & Consumption
Energy Use and Price by Sector
Energy Prices in Industry:
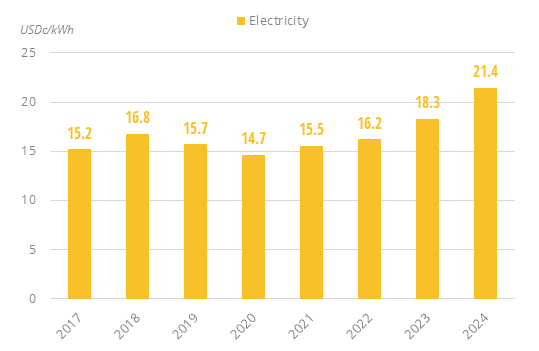
The price of electricity in industry has increased rapidly since 2020 (10%/year on average), reaching US$21.4c/kWh in 2024.
Graph: Energy Prices Including Taxes in Industry
Issues & Prospects
According to the National Energy Plan 2020-2050, energy demand will increase by 21% to 28% by 2050, with electricity and gas consumption increasing faster than oil consumption. Most of the electricity consumption rise will be linked to an increasing use of wind and solar technologies.
- Graph 1: Primary Consumption Trends by Energy Source
- Graph 2: Total Consumption Market Share by Energy (2024)
- Graph 3: Installed Electric Capacity by Source
- Graph 4: Installed Electric Capacity by Source (2024)
- Graph 5: Gross Power Production by Source & Consumption
- Graph 6: Power Generation by Source (2024)
- Graph 7: Crude Oil Production & Consumption
- Graph 8: Petroleum Products Production & Consumption
- Graph 9: Gas Production & Consumption
- Graph 10: Coal Production & Consumption
- Graph 11: GHG Emissions and CO2-energy Emissions
- Graph 12: Final Demand Trends by Energy Source
- Graph 13: Final Consumption by Sector
- Graph 14: Final Consumption Market Share by Sector (2024)
- Graph 15: Final Consumption in Industry by Energy Source
- Graph 16: Energy Prices Including Taxes in Industry
- Graph 17: Final Consumption in Transport by Energy Source
- Graph 18: Energy Prices Including Taxes in Transport
- Graph 19: Final Consumption in Residential, Services, Agriculture by Energy Source
- Graph 20: Energy Prices Including Taxes in Residential
- Graph 21: Upcoming New Capacity by Energy Source
- Economic Indicators: Annual historical data including population, GDP growth, imports and exports, inflation rate, energy security and efficiency indicators, CO2 emissions.
- Supply Indicators: Historical data including oil and gas reserves, electric and refining capacity, energy production, power production and external trade. All are detailed by energy source.
- Demand Indicators: Historical data including consumption per inhabitant, consumption trends, total consumption by energy source, final consumption by energy source and sector, and electricity consumption by sector.
- Energy Balances: Single table displaying the overall energy industry balance per annum, also graphically displayed by energy sub-segment.
The Colombia energy market data since 1990 and up to
is included in the Excel file accompanying the Colombia country report.
It showcases the historical evolution, allowing users to easily work with the data.
Key Data included in the excelsheet:
- Economic indicators: Annual historical economic indicators, energy security, energy efficiency and CO2 emissions.
- Supply indicators: Annual historical reserves, capacity, production and external trade (imports(+) exports(-) balance).
- Demand indicators: Annual historical consumption per capita, consumption trends, total consumption, final consumption (per energy and per sector) and electricity consumption total and per sector.
- Energy Balance: total and per energy.
- Colombia Energy Prices: In addition to the analysis provided on the report we also provided a data set which includes historical details on the Colombia energy prices for the follow items: price of premium gasoline (taxes incl.), price of diesel (taxes incl.), price of electricity in industry (taxes incl.), price of electricity for households (taxes incl.), price of natural gas in industry (taxes incl.), prices of natural gas for households (taxes incl.), spot price of Brent and CO2 emissions (from fuel combustion).