
- Update
- Format
- 3 files (PDF report, 2 Excel files)
- Pages
-
50 (Report only)
- Delivery
- Immediate by e-mail
- GENERAL OVERVIEW
- ENERGY AND CLIMATE POLICY FRAMEWORK
- ENERGY COMPANIES
- ENERGY SUPPLY AND DEMAND
- ENERGY USE AND PRICE BY SECTOR
- ISSUES AND PROSPECTS
- STATISTICS
- ABBREVIATIONS
- GLOSSARY
Buy Cambodia energy report
Price without VAT. Depending on your status and location, VAT might be applicable. Get in touch with us for more information.
After validation, you will immediately receive 3 files by email (one pdf report and 2 excel files containing the datasets).
Overview
Cambodia is advancing its energy transition with ambitious targets, including full electrification and a 70% renewable share in power generation by 2030. Governed by key ministries, its strategy integrates climate action, energy efficiency, and expanded renewables—particularly solar and hydropower—while phasing out new coal projects. Foreign investment and regional cooperation further support this shift.
Get more details on the table of contents and data files, as well as the list of graphs and tables by browsing the tabs below.
Highlights
- By 2030, Cambodia aims to increase the electrification rate from 92% to 100% and to raise the share of renewables in power generation to 70%.
- China Huadian accounts for 40% of total generation and most other large IPPs are owned by Chinese enterprises. Kampuchea Tela is the largest fuel distributor in the country.
- Electricity production was multiplied by 14 since 2010, fuelled by the expansion of coal-fired generation.
- Cambodia is increasingly reliant on coal in its energy mix and CO2 emissions from fuel quadrupled over 2010-24.
- Final energy consumption is growing very rapidly (8%/year over 2010-2024). Since 2010, the share of electricity in the final energy mix increased by 15 pp to 23%.
- In its new Power Development Plan, Cambodia plans to invest US$1.8bn to improve its electricity transmission network.
- Following the Government's decision to stop building new coal plants, a new 900 MW gas plant is expected by 2027.
Energy & Climate Policy Framework
The Ministry of Mines and Energy (MME) is in charge of the energy policy through the General Department of Energy (GDE).
Energy Companies
Electricity:
IPPs account for most of the capacity (86%) and power generation (98%) (2023). The largest IPP in the country is Huadian Sihanoukville Power Generation, an affiliate of state-owned China Huadian Corporation, which owns and operates a 700 MW coal-fired plant, accounting for 32% of power generation in 2023.
Energy Supply & Demand
Resources:
Cambodia has no proved crude oil or natural gas reserves. Its oil resources reached 25 Mt and its gas resources 50 bcm in 2024. The economically exploitable hydroelectric resources of the country are estimated at about 19 TWh.
Energy Use and Price by Sector
Energy Prices in Residential:
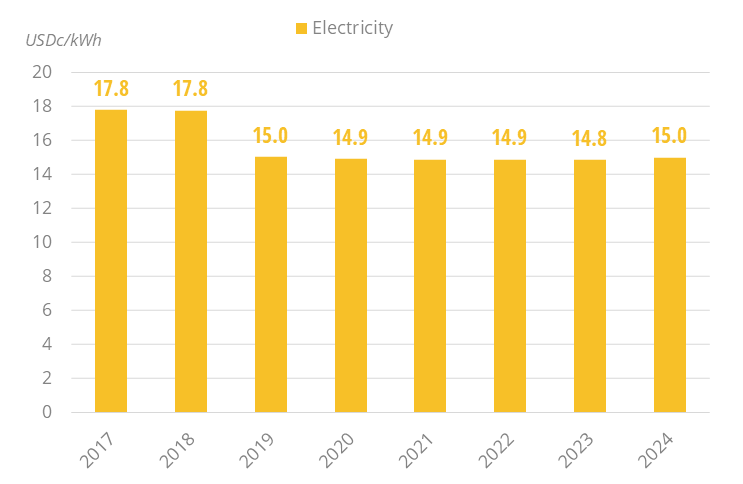
Since 2019, electricity prices for households are relatively stable, at USD15c/kWh, which is higher than most ASEAN countries.
Graph: Energy Prices in Residential (Taxes Included)
Issues & Prospects
Gas:
Historically, natural gas has not been part of Cambodia's energy mix. However, LNG-to-power projects have gained increasing attention from public authorities to address the rapidly rising electricity demand.
- Graph 1: Primary Consumption Trends by Energy Source
- Graph 2: Total Consumption Market Share by Energy (2024)
- Graph 3: Installed Electric Capacity by Source
- Graph 4: Installed Electric Capacity by Source (2024)
- Graph 5: Gross Power Production by Source & Consumption
- Graph 6: Power Generation by Source (2024)
- Graph 7: Petroleum Products Production & Consumption
- Graph 8: Coal Production & Consumption
- Graph 9: GHG Emissions and CO2-energy Emissions
- Graph 10: Final Demand Trends by Energy Source
- Graph 11: Final Consumption by Sector
- Graph 12: Final Consumption Market Share by Sector (2024)
- Graph 13: Final Consumption in Industry by Energy Source
- Graph 14: Energy Prices in Industry (Taxes Included)
- Graph 15: Final Consumption in Transport by Energy Source
- Graph 16: Energy Prices in Transport (Taxes Included)
- Graph 17: Final Consumption in Residential, Services, Agriculture by Energy Source
- Graph 18: Energy Prices in Residential (Taxes Included)
- Graph 19: Upcoming New Capacity by Energy Source
- Economic Indicators: Annual historical data including population, GDP growth, imports and exports, inflation rate, energy security and efficiency indicators, CO2 emissions.
- Supply Indicators: Historical data including oil and gas reserves, electric and refining capacity, energy production, power production and external trade. All are detailed by energy source.
- Demand Indicators: Historical data including consumption per inhabitant, consumption trends, total consumption by energy source, final consumption by energy source and sector, and electricity consumption by sector.
- Energy Balances: Single table displaying the overall energy industry balance per annum, also graphically displayed by energy sub-segment.
The Cambodia energy market data since 1990 and up to
is included in the Excel file accompanying the Cambodia country report.
It showcases the historical evolution, allowing users to easily work with the data.
Key Data included in the excelsheet:
- Economic indicators: Annual historical economic indicators, energy security, energy efficiency and CO2 emissions.
- Supply indicators: Annual historical reserves, capacity, production and external trade (imports(+) exports(-) balance).
- Demand indicators: Annual historical consumption per capita, consumption trends, total consumption, final consumption (per energy and per sector) and electricity consumption total and per sector.
- Energy Balance: total and per energy.
- Cambodia Energy Prices: In addition to the analysis provided on the report we also provided a data set which includes historical details on the Cambodia energy prices for the follow items: price of premium gasoline (taxes incl.), price of diesel (taxes incl.), price of electricity in industry (taxes incl.), price of electricity for households (taxes incl.), price of natural gas in industry (taxes incl.), prices of natural gas for households (taxes incl.), spot price of Brent and CO2 emissions (from fuel combustion).