ODYSSEE is a leading, user-friendly database that monitors energy consumption, its drivers, and associated CO2 emissions. It also assesses energy efficiency performance and trends across EU countries thanks to advanced indicators.
The database is updated three times a year through a network of partners and national energy agencies spanning over 37 countries, all part of the ODYSSEE-MURE project.
Enerdata has been a key contributor to this project for over 30 years.
The project

The project, supported by the European Commission’s LIFE programme, has developed two complementary databases: ODYSSEE and MURE. MURE specifically focuses on the implementation of energy efficiency policies, evaluating their quantitative and qualitative impacts at both national and EU levels.
Key Benefits
How to evaluate energy savings?
To assess energy savings and the impact of energy efficiency policies, policymakers, stakeholders, and researchers can leverage the specific data and policy tools provided by Odyssee and Mure databases. These resources offer access to homogeneous and harmonised energy efficiency trends and policies, categorised by sector and end-uses.
The Odyssee database can provide:
- Energy efficiency indicators and CO2 data
- An overall index of energy efficiency by country and sector (ODEX)
- Energy efficiency gains by sector, sub-sector and end-use, as well as associated energy savings
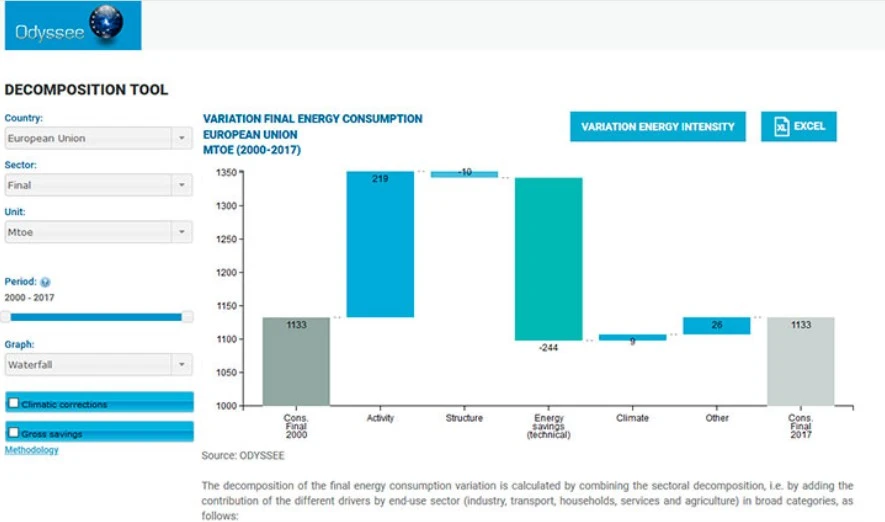
Odyssee decomposition tool
Need a complementary analysis on energy efficiency and energy consumption?
The Odyssee-Mure project can provide valuable tools to better understand trends in consumption, as well as benchmark energy efficiency progress across Europe. Take a look at our data tools developed by Enerdata.
Current phase of the project
Project name: ODYSSEE-MURE - Monitoring the EED-Recast
Project duration: 30 months (1 May 2025 - 31 October 2027)
Project coordinator: Fraunhofer ISI, info(at)odyssee-mure.eu
Project website: https://www.odyssee-mure.eu/
LinkedIn: www.linkedin.com/company/odyssee-mure
More information about the list of participants can be found here: https://www.odyssee-mure.eu/project.html
Co-funded by the European Union under project ID 101215674. Views and opinions expressed are, however, those of the author(s) only and do not necessarily reflect those of the European Union or CINEA. Neither the European Union nor the granting authority can be held responsible for them.