United States Key Figures
- Population:
- 335 million
- GDP growth rate:
- 2.09 %/year
- Energy independence:
- 100%
Data of the last year available: 2023
- Total consumption/GDP:*
- 68.4 (2005=100)
- CO2 Emissions:
- 14.7 tCO2/capita
- Rate of T&D power losses:
- 5.81%
* at purchasing power parity
View all macro and energy indicators in the United States energy report
United States Related News
View all news, archive your new and create your own daily newsletters only on your topics/countries of interest with Key Energy Intelligence
United States Related Research
Benefit from up to 2 000 up-to-date data series for 186 countries in Global Energy & CO2 data
A data overview is available in the global energy statistics app
Total Energy Consumption
Per capita consumption was around 6.5 toe/cap (including 12.1 MWh/cap of electricity) in 2023, which is more than 70% higher than the OECD average.
Interactive Chart United States Total Energy Consumption
Benefit from up to 2 000 up-to-date data series for 186 countries in Global Energy & CO2 data
View the detailed fondamentals of the market at country level (graphs, tables, analysis) in the United States energy report
Crude Oil Production
Oil production (crude and NGL) increased by 7% in 2023, reaching 820 Mt, after a progression in 2022 (+1%) and a significant rebound in 2021 (6.5% and), after a 5% drop in 2020. It more than doubled between 2011 and 2019 (10%/year). Non-conventional sources now account for more than 50% of total oil production. Since 2017, the United States has become the largest oil producer in the world. Oil production is concentrated in onshore Texas, around the Gulf of Mexico, North Dakota, California, and Alaska.
Interactive Chart United States Crude Oil Production
Benefit from up to 2 000 up-to-date data series for 186 countries in Global Energy & CO2 data
Additionally, for more detailed information on refineries, you can request a sample of our America Refineries Dataset
Oil Products Consumption
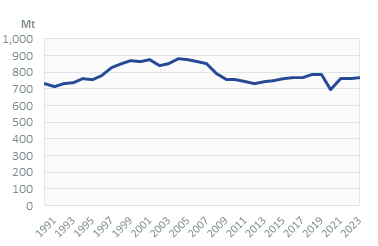
Oil consumption increased by 1.2% in 2023 to 769 Mt, after a little decrease in 2022 (-0.3%) following a strong rebound in 2021 (+9%) and a significant drop in 2020 (-12%). It increased moderately (1%/year) between 2012 and 2019. It now stands 13% below its 2004 peak of 880 Mt.
Graph: OIL CONSUMPTION (Mt)
Interactive Chart United States Refined Oil Products Production
Benefit from up to 2 000 up-to-date data series for 186 countries in Global Energy & CO2 data
Additionally, for more detailed information on refineries, you can request a sample of our America Refineries Dataset
Natural Gas Consumption
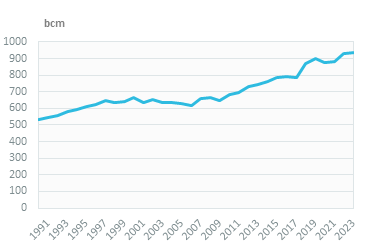
Gas consumption increased by 0.6% in 2023 to 937 bcm, after a large increase in 2022 (+5.5%) and a slow progression in 2021 (+0.8%). It increased rapidly between 2009 and 2019 (3%/year), because of a fuel switch from coal to gas in power generation and decreased by 3% in 2020.
Graph: NATURAL GAS CONSUMPTION (bcm)
Interactive Chart United States Natural Gas Domestic Consumption
Benefit from up to 2 000 up-to-date data series for 186 countries in Global Energy & CO2 data
Additionally, for more detailed information on the LNG trade, you can request a sample of our America LNG Trade Dataset
Coal Consumption
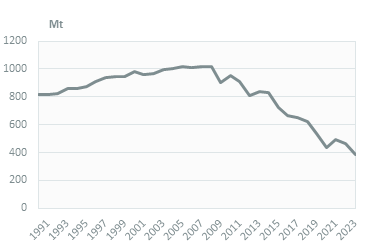
Coal and lignite consumption decreased sharply in 2023 to 384 Mt (-18%). Since 2007, consumption has dropped by 62%.
Graph: COAL CONSUMPTION (Mt)
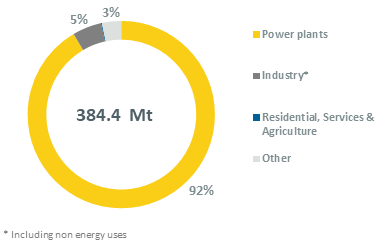
The power sector accounts for most of the coal and lignite consumption (92%); the rest of the energy sector and industry consume the remainder.
Graph: COAL CONSUMPTION BREAKDOWN BY SECTOR (2023, %)
Interactive Chart United States Coal and Lignite Domestic Consumption
Benefit from up to 2 000 up-to-date data series for 186 countries in Global Energy & CO2 data
View the detailed consumption trends at country level (graphs, tables, analysis) in the United States energy report
Power Consumption
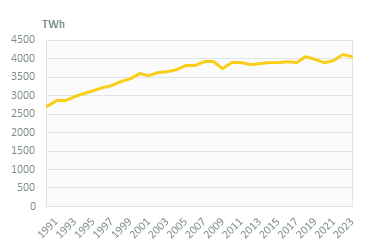
Electricity consumption decreased by 1% in 2023 to 4065 TWh after a progression by 2%/year between 2020 and 2022. It was relatively stable over 2010-2019 (0.2%/year) and dipped by 1.5% in 2020.
Graph: ELECTRICITY CONSUMPTION (TWh)
The main consuming sectors are residential (36%), services (34%) followed by industry (21%).
Graph: ELECTRICITY CONSUMPTION BREAKDOWN BY SECTOR (2023, %)
Renewable in % Electricity Production
The objective of a 20% share of renewables in the power mix in 2020 was reached and no further objectives were formulated on a federal level.
The last NDC aims at having a fully decarbonized power generation system by 2035.
The DOI has updated its renewable energy regulations to encourage the development of solar and wind energy on public lands. The Renewable Energy Rule by the BLM,Bureau of Land Management (2022), aims to reduce fees for such projects by approximately 80%. The BLM has a mandate to permit 25 GW of renewable energy on federal lands by 2025.
Interactive Chart United States Share of Renewables in Electricity Production (incl hydro)
Benefit from up to 2 000 up-to-date data series for 186 countries in Global Energy & CO2 data
CO2 Fuel Combustion/CO2 Emissions
In 2021, the US administration has pledged to reduce the country's GHG emissions by 50-52% below 2005 levels by 2030, included LULUCF and agriculture. This target was included in the country's updated NDC in 2022, with an intermediate goal of 26-28% below 2005 levels in 2025; this is twice more ambitious than the objective set in the first NDC. In 2016, the US (representing around 18% of global GHG emissions) formally ratified the Paris agreement on climate change in 2021, after its withdrawal by the Trump administration in 2020.