World energy expenditures have more than doubled in 20 years
More than US$6,000bn1 -10% of the world Gross Domestic Product (GDP)- is spent each year in the world for energy purposes. This places energy second to health care expenditures in many countries; and in some cases first.
Breakdown of the consumer energy expenditures in 1990 and 2010
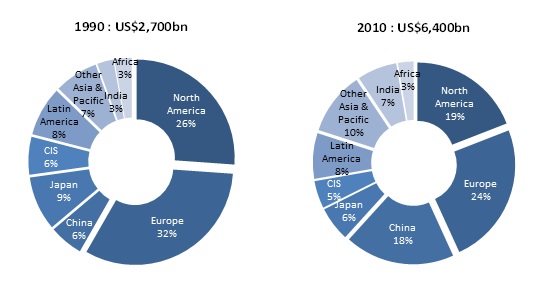
Source: Global Energy Data - Enerdata
OECD countries contribute to more than half of the expenditures. Europe spends close to one fourth of the world energy expenditures, whereas Americans alones contribute to close to 20% and Japanese to 6%. However their share is decreasing steadily - as they represented two third of the spending in 1990 - due to the explosion of the energy consumption in developing countries and in particular in China. Indeed China who contributed to only 6% of the energy expenses in 1990 contributes now to about 18%; just below the United States contribution.
Booming growth rates of expenditures per capita in emerging countries, still far behind developed countries
The Japanese, Americans and Europeans spend, by far, much more than the other regions in the World. Their expenditures are between 3 and 4 times the world average, ranging between 2,500 and 3,500 US$1 per capita.
Consumer energy expenditures per capita and share in GDP by region
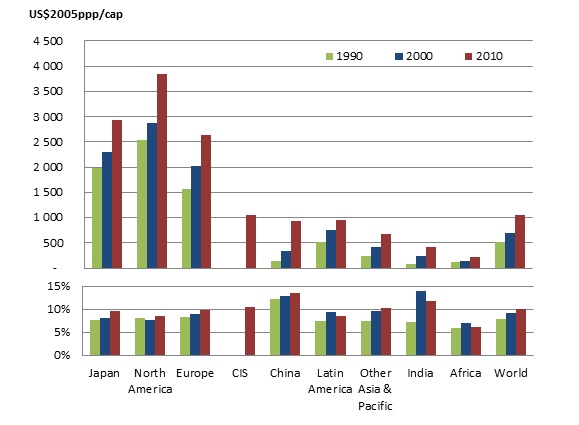
Global Energy Data - Enerdata
The United States, with the highest energy consumption per capita, ranks first followed by Japan and Europe. But the gap between the United States and Japan or Europe is much less than the gap in terms of energy consumption as American consumers benefit from lower prices. Indeed, as the United States is an oil and gas producing country with low taxation rates, US oil and gas prices are more than two times lower than in Japan and in Europe2. The level of expenditures per capita is much lower in other regions. They are between 500 and 1000 US$1 per capita for China, CIS and Latin America and are below 500 US$ per capita in India and Africa due to low energy consumption1. The share of expenses in the GDP is much more homogeneous among regions. It is about 10% for almost all regions except India and China for which it accounts to 12-13% and Africa where it is below 6%. Not surprisingly, oil has the biggest impact on consumers’ energy bill with about half of the energy expenditures for almost all regions, whereas electricity ranks second with about one third of the spending. Two main drivers explain the sharp increase since 1990. In the 1990’s the increase was largely driven by the higher energy consumption per capita. Since 2000, soaring international prices has contributed to 85% of the spending’s growth at World level. In the same period most countries experienced a decrease in the energy intensity (energy consumption per dollar of GDP), due to energy efficiency improvements and to a lesser extent to structural shifts in economies. As a result, the share of expenditures in the GDP increases slightly compared to the total spending and can even decrease. In India, for instance, the share has decreased by 2 percentage points, 1 point in Latin America and Africa and a reduction in the United States between 1990 and 2000. The impact is not as obvious for other regions as it is counterbalanced by the increase in energy prices.
What impacts on energy taxes incomes for States?
Energy expenditures generate significant incomes for governments as taxes represent a significant share of spending. Taxes represent more than 5% of the energy expenditures (i.e. about US$70bn) in the United States, more than 10% in Japan (i.e. US$40bn) and close to one third of energy spending in European countries (i.e. US$500bn).
Share of taxes in consumer energy expenditures per capita
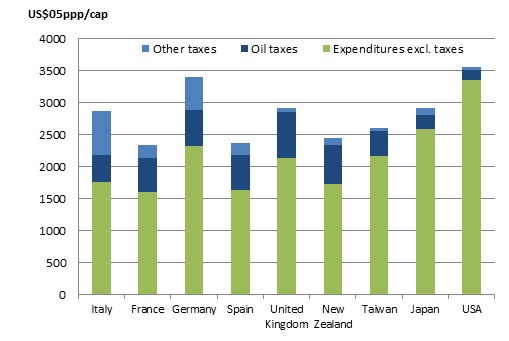
Source: Global Energy Data - Enerdata
Taxes on fossil fuels represent an important source of revenue for governments as they account for about 3% of government’s budgets in the United States, 5% in Japan, France and the United Kingdom and up to 10% in Germany, Spain and Italy. Among fossil fuel taxes, taxes on petroleum products account for about 50%- of which the major part is directly derived from motor fuel taxes. But these revenues may stagnate and even decline with the continuation of energy efficiency improvement and the switch from fossil fuels to renewables, which are presently subject to much lower -or none- direct tax rates. This trend potentially represents a huge hole in tax income from petroleum products. As a result, governments will probably have to adapt the tax system to this new environment, to maintain this crucial source of revenues. Notes: 1 At exchange rate and purchasing power parities of the year 2005 (US$2005ppp). 2 Respectively 60% for oil and 3 times for gas for Japan -which suffers of high costs of gas supply due to LNG.