Enerdata, an independent Research and Consultancy Firm specialized in the global energy industry and carbon market since 1991, published its annual analysis of world energy demand.
The USA returned to a dynamic growth level, while the BRICS kept driving energy demand
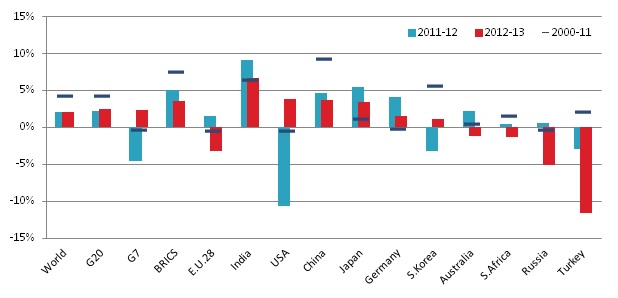
The year 2013 is characterised by a slight increase in the world energy consumption (+1.9%, compared to +1.8% in 2012 and +1.6% in 2011), driven by the slowing but still dynamic rise of energy needs in BRICS 1 countries (+3.5% in 2013, +4.4% in 2012 and +5.6%/year average between 2000 and 2011) and the return to positive energy demand in the USA (+2.5%) following two years of reduction (-2.6% in 2012 and -1.1% in 2011). Although the Chinese’s energy consumption recorded the highest increase among the G202 countries in 2013 (+4.7%), it has continued its slowdown trend that has been observed over the three past years (+10.1% in 2010, +8.4% in 2011 and +5.5% in 2012). This slowdown compared to the previous decade directly affected the world’s trend as China represented 22% of the global energy consumption in 2013 (12% in 2000).
Figure 1 : Energy consumption growth in the world major countries (%/year)
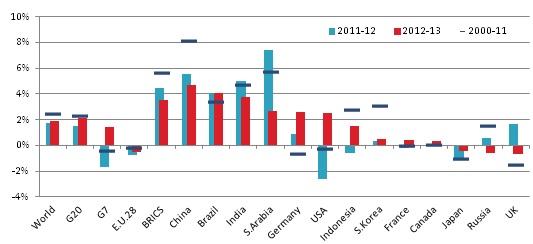
Source: Enerdata - Global Energy and CO2 Data
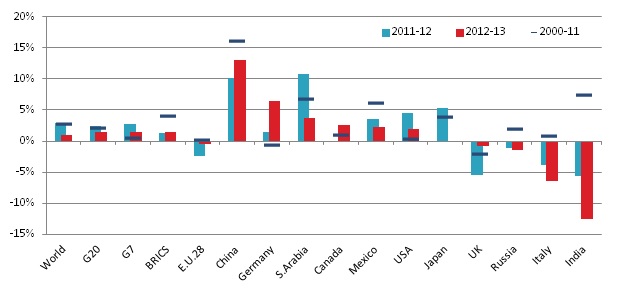
Aside from the USA, European Union members are pursuing their energy consumption shrinkage (-0.6% in 2013). In this sluggish European context, Germany, the largest European energy consumer, showed a vigorous energy consumption growth in 2013 (+2.6%), while some major European countries, such as Romania (-10.9%), Spain (-6.2%) or Italy (-3.7%), recorded noticeable drops. As a result, the EU now accounts for no more than 12% of the global energy consumption, a 5 percentage point drop compared to the situation in 2000. Conversely, BRICS countries confirmed their increasingly dominant role in the new global energy landscape with a share close to 40% in 2013 compared to approximately 25% in 2000.
Figure 2 : Primary energy consumption evolution by countries between 2000 and 2013
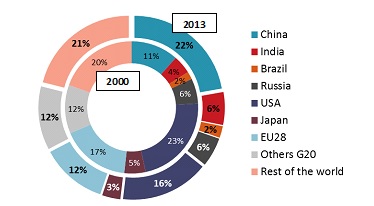
Source: Enerdata - Global Energy and CO2 Data
CO2 emissions continue to rise as coal met 40% of the 2013 rise in energy consumption
For the fourth year since 2008, coal was the main contributor to the world energy demand growth with a consumption rise of 102 Mtoe in 2013 (+1.9%), representing about 40% of the additional primary energy consumed.
Figure 3 : World primary energy consumption evolution in 2013 (Mtoe)
.jpg)
Source: Enerdata - Global Energy and CO2 Data
*: nuclear, hydropower, wind, solar and geothermal; **: biomass and heat As a result, energy-related CO2 emissions continued to rise (+1.8% in 2013, i.e. 31.1 GtCO2), at a very similar rate as the growth in global energy demand (+1.9%). The growth of CO2 emissions in China, the world largest CO2 emitter, followed the decelerating energy consumption trend and slowed down for the third consecutive year. Europe pursued its downward trend (-1.7% in 2013, -1.4% in 2012), Germany being an exception among large European countries with an increase of +2.9% in 2013 (+1.8% in 2012).
Figure 4 : CO₂ emissions growth in major countries (%/year)
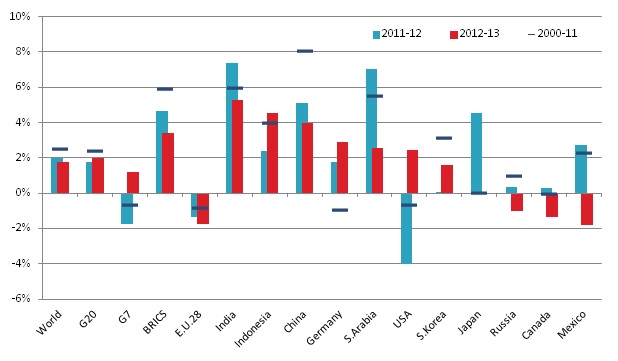
Source: Enerdata - Global Energy and CO2 Data
Although energy-related CO2 emissions per capita continued to decrease in Europe (6.6 tCO2/cap in 2013 compared to 8 tCO2/cap in 2000), emissions per capita in China are experiencing the opposite trend. CO2 emission levels in both regions are now very close to each other however a European still consumes 1.5 times more energy than a Chinese citizen. This is due to the fact that the Chinese power mix is highly dominated by coal, while the European one is cleaner in terms of CO2 emissions. Although declining, energy-related CO2 emissions per capita in the USA are still nearly 2.5 times higher than in Europe.
Figure 5 : CO₂ emissions per capita evolution in major G20 countries
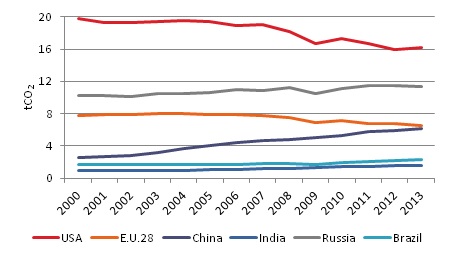
Source: Enerdata - Global Energy and CO2 Data
The oil consumption rebound in the USA drives the world consumption upward
In 2013, oil preserved its dominating position at the world level in 2013 with a market share of 31% (3 Gt), down from 36% in 2000 (2.7 Gt). Oil consumption grew by +0.9% in 2013, slightly above its 2012 growth (+0.8%), mainly due to the return to a positive growth in the USA (+1.6%), that represents a quarter of the world’s oil consumption, after six years of contraction since 2006. Although the BRICS’s oil demand growth was high in 2013, it was cut in half (+2.6%) compared to 2012 (+4.9%), mainly due to the Chinese deceleration (from +6% to +3%). In spite of the slowdown of its growth in oil demand, the Chinese needs have kept increasing and they rely more and more on imports. Conversely, the USA has dramatically reduced its overseas dependence thanks to a surge in its indigenous oil production, driven by shale and tight oil production in Texas and North Dakota. As a result, China almost caught up to the USA in terms of oil volumes imported in 2013 and should surpass the USA in 2014.
Figure 6 : Net oil imports (crude and petroleum products) in China and the USA (2005-2013)
-in-China-and-the-USA-(2005-2013).jpg)
Source: Enerdata - Global Energy and CO2 Data
For the ninth year in a row, the EU recorded a drop in its oil demand (-1.2% in 2013) with Germany being once more an exception with a growth of +2.1% in 2013.
Coal consumption raised for the thirteenth year in a row
Coal, which accounts for 29% of the world energy mix (23% in 2000) and dominates the G20’s energy mix since 2007, saw its global consumption grow in 2013 by +2.1% (same figure as in 2012), only half of the annual increase of +4.2%/year recorded between 2000 and 2011. The world coal consumption has increased every year since 2000 to reach 7.8 Gt in 2013. The return to positive figures in the USA (+3.9% in 2013 against -10.7% in 2012), due to a gas-to-coal switch in the power industry as a result of low domestic coal prices and increasing gas prices, partly offset the slowdown in the BRICS countries (+3.6% in 2013 against +5% in 2012 and +7.5%/year on average between 2000 and 2011). In Europe, the reduction of coal consumption (-3.2%) is mainly due to low power demand resulting in overcapacities that has led to the anticipation of the phasing-out of inefficient coal-fired power plants in Belgium, France and the United-Kingdom, planned within the framework of the European Large Combustion Plant Directive (LCPD).
Figure 7 : Coal demand growth in the G20 major countries (%/year)
Source: Enerdata - Global Energy and CO2 Data
The gas price rise in the USA resulted in a pronounced slowdown in consumption growth
The world gas consumption progressed by a timid +0.9%, down from the dynamic growth recorded in 2012 (+2.9%) and over the past decade (+2.7%/year between 2000 and 2011). The 2013 slowdown is explained by the gas consumption deceleration in the USA (+2% in 2013 against +4.5% in 2012), which represents a fifth of the global demand, due to a significant gas price increase (+35% on average between 2012 and 2013). Meanwhile, the Russian and the European gas consumption (13% and 14% of the world demand, respectively) shrunk by -1.4% and -0.7% in 2013, respectively, for the second year in a row. In Russia the drop was mainly due to the rise in households’ prices; in Europe it is mainly explained by a warm winter as well as a low demand and the substitution of coal in power generation due to low international coal prices.
Figure 8 : Gas demand growth in the G20 major countries (%/year)
Source: Enerdata - Global Energy and CO2 Data
Conversely, the Chinese demand growth kept its high rate with a +13% increase in 2013, slightly below the trend observed during the past decade (16.2%/year on average between 2000 and 2011). After strong increases in 2011 (+16.3%) and 2012 (+5.4%) resulting from the Fukushima event in March 2011, Japan recorded stable gas consumption in 2013 in a context of high gas prices in Asia.
Figure 9 : Gas prices evolution on the three major gas markets
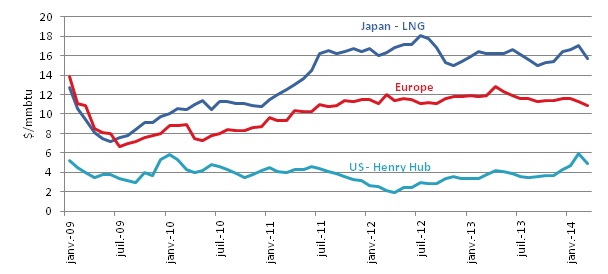
Source: Enerdata - from US DoE, EDMC and NBP
The renewable energy sources dominate the European power mix
The constant development of renewable energy sources (including hydroelectricity and biomass) led them to dominate the European power mix for the first time in 2013: they accounted for 31% of the electricity generated in Europe3, exceeding the shares of coal (27%), nuclear (24%) and gas (17%).
Figure 10 : European power mix evolution between 2000 and 2013
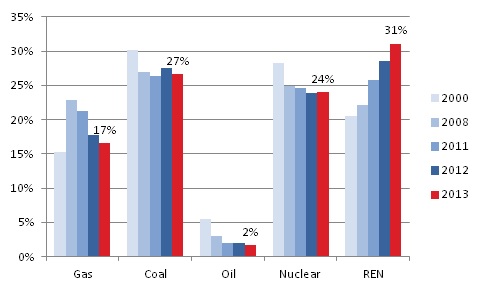
Source: Enerdata - Global Energy and CO2 Data
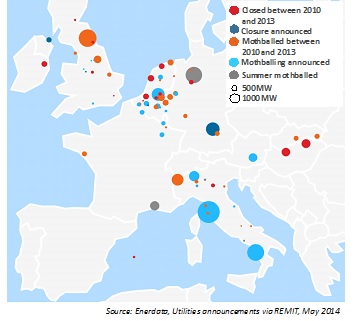
This triggered the mothballing or closure of an increasing number of gas-fired power plants that have become unprofitable due to insufficient utilisation (less than 3,000 hours on average in Germany in 2013). As a result, utilities face lower income due to low demand for thermal power generation. This situation deteriorates the return on investment of fossil fuels-based power assets that are required to meet the peak electricity demand.
Figure 11 : Power plants already closed or mothballed and announcements
PV installations take-off in Asia
Although Europe stayed a major player in the development of renewable energy sources, one of the most important trends in 2013 was Asian solar photovoltaics increase: 7 GW of new installed capacity in China and 7 GW in Japan. The extension of regulatory incentives in Asian countries (China, Japan, and India) has largely contributed to this key development.
Figure 12 : PV new installed capacities in the world in 2013
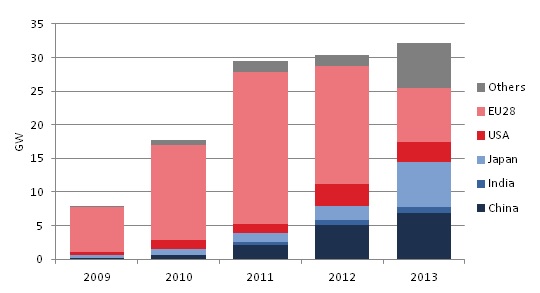
Source: Enerdata - Global Energy and CO2 Data
It is quite the opposite in the USA for the wind turbine market where uncertainty around the regulatory framework has temporarily stopped or postponed many projects. For the fourth consecutive year, China was the most dynamic country with more than 13 GW of new installed capacity. Europe remains the renewable energy leader with nearly 200 GW of installed capacities, of which 120 MW are wind and 80 GW are solar.
Figure 13 : Wind new installed capacities in the world in 2013
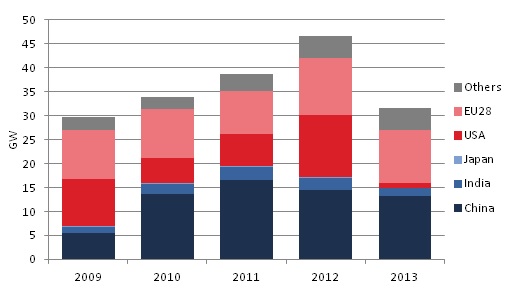
Source: Enerdata - Global Energy and CO2 Data
Notes: 1 BRICS = Brazil, Russia, India, China, South Africa 2 G20 = Argentina, Brazil, Mexico, the USA, Canada, Australia, China, India, Indonesia, Japan, South Korea, Russia, Saudi Arabia, South Africa, Turkey, France, Germany, Italy, the UK, the E.U.28 3 Europe: the E.U.28., Albania, Bosnia, Iceland, Kosovo, Macedonia, Montenegro, Norway, Serbia, Switzerland and Turkey