
- Update
-
- Format
- 3 files (PDF report, 2 Excel files)
- Pages
-
47 (Report only)
- Delivery
- Immediate by e-mail
- GENERAL OVERVIEW
- ENERGY AND CLIMATE POLICY FRAMEWORK
- ENERGY COMPANIES
- ENERGY SUPPLY AND DEMAND
- ISSUES AND PROSPECTS
- STATISTICS
- ABBREVIATIONS
- GLOSSARY
Buy Equatorial Guinea energy report
Price without VAT. Depending on your statute and location, VAT might be applicable. Get in touch with us for more information.
After validation, you will immediately receive 3 files by email (one pdf report and 2 excel files containing the datasets).
Overview
Equatorial Guinea, a key oil and gas producer in sub-Saharan Africa, is advancing its energy sector through upcoming licensing rounds, strategic gas hub developments, and efforts to rehabilitate its electricity network while targeting emissions reductions.
Get more details on the table of contents and data files, as well as the list of graphs and tables by browsing the tabs below.
Highlights
- Equatorial Guinea announced a new oil and gas licensing round, scheduled in April 2026.
- GEPetrol, the national oil company, plans to redevelop the Zafiro oil field following ExxonMobil's departure and the transfer of assets.
- ConocoPhillips and Chevron are the main gas producers.
- Crude oil production has decreased by 69% since 2014.
- Gas production has experienced a significant recovery since 2019-2020.
- Final energy demand fluctuates a lot because of the industrial sector, which represents the bulk of this consumption.
- Chevron approved a final investment decision for the Aseng Gas Monetisation project in April 2026.
- Construction of the 200-MW Sendje hydropower plant resumed in 2025 after several years of deadlock.
Energy & Climate Policy Framework
Equatorial Guinea is a small country consisting of two main parts: the island of Bioko, in the Gulf of Guinea, which is where the country's capital Malabo is located; and a mainland region that is bordered by Cameroon to the north and by Gabon to the south and east.
The Ministry of Industry and Energy oversees the development and implementation of energy policies.
Energy Companies
Electricity:
Segesa Generación directly or indirectly owns 100% of the capacity.
Energy Supply & Demand
Gas:
Marketed gas production recovered to 7.7 bcm in 2024, following a 12% decline the previous year (7.3 bcm). This fluctuation follows a period of robust growth between 2020 and 2022 (+16%/year), when output peaked at 8.3 bcm, returning to levels last seen in 2017. Production declined rapidly decline between 2017 and 2020 (-9%/year).
Issues & Prospects
Electricity:
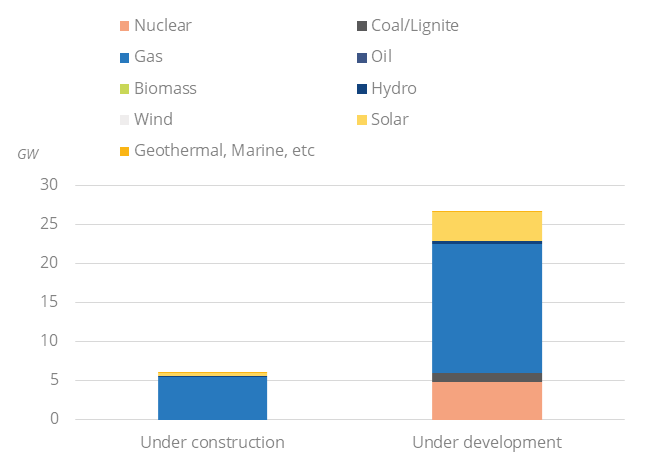
The pipeline of projects for new power generation capacity under construction amounts to 0.3 GW.
Graph: Upcoming New Capacity by Energy Source
- Graph 1: Primary Consumption Trends by Energy Source
- Graph 2: Total Consumption Market Share by Energy (2024)
- Graph 3: Installed Electric Capacity by Source
- Graph 4: Installed Electric Capacity by Source (2024)
- Graph 5: Gross Power Production by Source & Consumption
- Graph 6: Power Generation by Source (2024)
- Graph 7: Crude Oil Production & Consumption
- Graph 8: Petroleum Products Production & Consumption
- Graph 9: Gas Production & Consumption
- Graph 10: Emissions of GHG and CO2 from Fuel Combustion
- Graph 11: Final Demand Trends by Energy Source
- Graph 12: Final Consumption by Sector
- Graph 13: Final Consumption Market Share by Sector (2024)
- Graph 14: Final Consumption in Industry by Energy Source
- Graph 15: Final Consumption in Transport by Energy Source
- Graph 16: Final Consumption in Residential, Services, Agriculture by Energy Source
- Graph 17: Upcoming New Capacity by Energy Source
- Economic Indicators: Annual historical data including population, GDP growth, imports and exports, inflation rate, energy security and efficiency indicators, CO2 emissions.
- Supply Indicators: Historical data including oil and gas reserves, electric and refining capacity, energy production, power production and external trade. All are detailed by energy source.
- Demand Indicators: Historical data including consumption per inhabitant, consumption trends, total consumption by energy source, final consumption by energy source and sector, and electricity consumption by sector.
- Energy Balances: Single table displaying the overall energy industry balance per annum, also graphically displayed by energy sub-segment.
The Equatorial Guinea energy market data since 1990 and up to
is included in the Excel file accompanying the Equatorial Guinea country report.
It showcases the historical evolution, allowing users to easily work with the data.
Key Data included in the excelsheet:
- Economic indicators: Annual historical economic indicators, energy security, energy efficiency and CO2 emissions.
- Supply indicators: Annual historical reserves, capacity, production and external trade (imports(+) exports(-) balance).
- Demand indicators: Annual historical consumption per capita, consumption trends, total consumption, final consumption (per energy and per sector) and electricity consumption total and per sector.
- Energy Balance: total and per energy.
- Equatorial Guinea Energy Prices: In addition to the analysis provided on the report we also provided a data set which includes historical details on the Equatorial Guinea energy prices for the follow items: price of premium gasoline (taxes incl.), price of diesel (taxes incl.), price of electricity in industry (taxes incl.), price of electricity for households (taxes incl.), price of natural gas in industry (taxes incl.), prices of natural gas for households (taxes incl.), spot price of Brent and CO2 emissions (from fuel combustion).